FI OrderFlow Documentation
Complete reference for installing, configuring, and trading with the FI OrderFlow indicator for NinjaTrader 8. Covers all three modes, every signal, and a full glossary of footprint terms.
New to order flow?
Our free learning section covers the concepts behind this indicator in depth:
Installation
The FI OrderFlow indicator is delivered as a .zip file that you import directly into NinjaTrader 8.
Download the indicator
Log in to your dashboard and download the latest .zip file. Do not extract the archive.
Import into NinjaTrader 8
Open NinjaTrader 8 and go to Control Center → Tools → Import → NinjaScript Add-On. Select the downloaded .zip file and click Open.
Restart NinjaTrader
Close and reopen NinjaTrader 8 to complete the installation. The indicator will appear in your indicators list as FIOrderFlow.
Add to a chart
Right-click any chart → Indicators → search for FIOrderFlow → click Add.
Set the indicator mode
Before pressing OK, find the IndicatorMode property in the parameters panel. Select the mode that matches your use case:
- FootPrint — Bid/ask volume at every price level, overlaid on the price panel. Best for scalping and real-time tape reading.
- VolumeProfile_And_MarketProfile — Session TPO letters and volume profiles on the price panel. Best for context and value area analysis.
- VolumeProfile_And_CumulativeDelta — Delta candles in a separate panel below the chart. Best for divergence and trend confirmation.
You can change the mode later by opening the indicator properties (right-click chart → Indicators → select FIOrderFlow → edit).
Configure chart settings for your mode
Each mode requires specific NinjaTrader chart settings to work correctly. Set these before applying the indicator:
FootPrint mode
Use Bars instead of Days in the Data Series window. 200 bars keeps the footprint session fast and focused on recent price action. For 5-minute charts and below this is the recommended setup.
VolumeProfile_And_MarketProfile mode
30-minute bars are required for proper TPO letter formation. 14 days provides enough history for composite profiles, naked levels, and value area migration.
VolumeProfile_And_CumulativeDelta mode
The delta panel runs independently below your chart. 3 days of data on a 1m, 2m, or 5m chart gives you enough session history without processing millions of ticks on startup.
Performance note: This indicator uses Calculate on each tick, which means it processes every single tick in your chart history. A single trading day on ES or NQ can contain over a million ticks. On smaller timeframes (1m, range bars, tick charts), we strongly recommend loading no more than 3 days of data. Loading 5+ days on a tick-heavy instrument can mean processing tens of millions of ticks, causing long startup times and high memory usage.
Licensing & Activation
When you first load the indicator, it will prompt you for your license key. You can find your key in your licenses dashboard.
License key format: XXXX-XXXX-XXXX-XXXX
Machine lock: Your license is tied to one machine at a time. If you need to move it to a new computer, use the machine reset option in your dashboard.
Trial licenses: Trial keys give you 5 days of full access. All features are unlocked during the trial period.
Validation: The indicator validates your license periodically. An active internet connection is required for the initial activation.
Indicator Modes
FI OrderFlow operates in three distinct modes. You select the mode via the IndicatorMode property when adding the indicator to your chart. Each mode serves a different analytical purpose.
Mode 1: Footprint
Overlay: Renders directly on the price panel
The core footprint mode. Replaces standard candlesticks with detailed bid/ask volume data at every price level inside each bar. This is the mode you use for reading order flow in real-time: spotting imbalances, absorption, exhaustion, and institutional activity.
Best for: Scalping, intraday entries, reading the tape, identifying aggressive buyers/sellers.
Chart type: Works on any bar type but is most useful on range bars (e.g., 10-tick, 4-range) or short time-based bars (1m, 5m).
Data loading: Footprint mode uses Bars as the data type — not days. The indicator loads a maximum of 200 bars of history, not a full trading day. This keeps startup fast and memory usage low, especially on range and tick charts where a single session can produce thousands of bars.
Mode 2: Volume Profile & Market Profile (TPO)
Overlay: Renders directly on the price panel
Displays session-based volume profiles and TPO (Time Price Opportunity) letter charts. Identifies the Point of Control, Value Area, Initial Balance, single prints, poor highs/lows, and profile shape classification. Supports multi-session composite profiles.
Best for: Context analysis, identifying value areas, support/resistance from prior sessions, understanding market auction structure.
Chart type: Best on 30-minute or 1-hour charts for clear TPO letter formation.
Required: Set your chart timeframe to 30 minutes for proper TPO letter formation. Each 30-minute period generates one TPO letter (A, B, C, etc.) — this is the standard Market Profile convention. Using a different timeframe will produce incorrect letter assignments.
Recommended: Load at least 14 days of 30-minute bars for full analysis. This gives the indicator enough session history for accurate composite profiles, naked level detection, and value area migration analysis.
Mode 3: Volume Profile & Cumulative Delta
Panel: Renders in its own indicator panel below the chart
Plots cumulative delta as candles in a separate panel with optional EMA, Bollinger Bands, and session volume profile overlay. Use this to spot divergences between price and buying pressure across the session.
Best for: Trend confirmation, delta divergence, session-level analysis, swing trading context.
Chart type: Works on all bar types. The delta panel is independent of the price chart above.
Footprint Display Modes
When running in Footprint mode, you can cycle through different display styles using the chart toolbar. Each shows the same underlying data in a different visual format.
Bid / Ask
Two columns per bar showing bid volume on the left and ask volume on the right at every price level. The default and most detailed view.
VP + Imbalances
Volume profile bars at each level with diagonal imbalances highlighted. Quick way to see where aggressive activity is concentrated.
VP + Bid/Ask
Combines volume profile visualization with bid/ask numbers overlaid.
Candle + VP
Standard candlestick body with a session volume profile displayed alongside.
Candle + VP + Imbalance
Candlestick with volume profile and diagonal imbalance highlights.
Delta Profile
Shows net delta (ask minus bid) at each price level as a horizontal histogram. Green bars for positive delta, red for negative.
Signal Reference
Every signal can be toggled on or off independently. They are grouped by category below. All signals work in Footprint mode and appear on the Order Flow panel.
Imbalance & Volume Signals
Diagonal Imbalance
NeutralWhen askDefinitionThe lowest price someone is currently willing to sell at. If you buy at market, this is what you pay. volume at one price exceeds the bidDefinitionThe highest price someone is currently willing to pay to buy. If you sell at market, this is what you get. volume at the price below (or vice versa) by the imbalanceDefinitionA price level where one side overwhelms the other by 3:1 or more. Shows where big players committed. threshold ratio (default 3x). Indicates aggressive one-sided activity.
Stacked Imbalances
InstitutionalThree or more consecutive diagonal imbalancesDefinitionA price level where one side overwhelms the other by 3:1 or more. Shows where big players committed. in the same direction across price levels. Stronger signal than a single imbalance — shows sustained institutional aggression.
Big Imbalance
NeutralRaw volume at a single level exceeding the volume threshold. Highlights levels where unusually large orders were filled.
Oversized Imbalance
InstitutionalExtreme ratio imbalanceDefinitionA price level where one side overwhelms the other by 3:1 or more. Shows where big players committed. where one side dwarfs the other far beyond the standard threshold. Rare but high-conviction signal.
Inverse Imbalance
BearishStacked imbalancesDefinition3+ consecutive price levels where one side overwhelms the other by 3:1. Marks institutional zones. that contradict the bar's direction. For example, stacked sell imbalances inside a green bar. Signals potential reversal or hidden weakness.
Reversal Imbalance
BearishExtreme imbalanceDefinitionA price level where one side overwhelms the other by 3:1 or more. Shows where big players committed. at a price level that contradicts the overall bar direction. A strong sell imbalance at the top of a bull bar, for instance.
Big Trades
InstitutionalAbnormally large individual block trades at a price level. Flags potential institutional iceberg orders or large program trades.
Relative Volume
NeutralPrice levels where volume significantly exceeds the average for that session. Highlights where the real action is happening.
Delta & Momentum Signals
Big Delta
NeutralNet deltaDefinitionAsk volume minus bid volume. Positive = more buying. Negative = more selling. Shows who is more aggressive. (askDefinitionThe lowest price someone is currently willing to sell at. If you buy at market, this is what you pay. minus bidDefinitionThe highest price someone is currently willing to pay to buy. If you sell at market, this is what you get.) for the entire bar exceeds 2x the chart's running average. Shows abnormally strong one-sided activity for that bar.
Max Delta
NeutralHighlights the price level within each bar that had the highest positive or negative deltaDefinitionAsk volume minus bid volume. Positive = more buying. Negative = more selling. Shows who is more aggressive.. Shows where the most aggressive trading occurred.
Exhaustion
BearishA bar makes a new high but has no meaningful buying at the top (or a new low with no selling at the bottom). The move is running out of fuel. Classic reversal signal.
Absorption
InstitutionalLarge volume is absorbed at a price level without moving price further. Passive limit orders are soaking up aggressive market orders. Often precedes a reversal.
Delta Divergence
BearishPrice makes a new high/low but cumulative deltaDefinitionRunning total of buying vs selling across the session. Shows who has been in control overall. does not confirm. Buyers are pushing price up but the underlying order flow is weakening.
Delta Rise
BullishFour or more consecutive bars with increasing deltaDefinitionAsk volume minus bid volume. Positive = more buying. Negative = more selling. Shows who is more aggressive.. Momentum is building — buyers are getting more aggressive with each bar.
Delta Drop
BearishFour or more consecutive bars with decreasing deltaDefinitionAsk volume minus bid volume. Positive = more buying. Negative = more selling. Shows who is more aggressive.. Momentum is fading — the move is losing participation.
POC Momentum Wave
NeutralThe Point of ControlDefinitionThe price level with the highest volume. Represents fair value — where the market attracted the most interest. shifts consistently higher or lower across consecutive bars. Shows where the heaviest volume is migrating — a strong directional signal.
Fading Momentum
BearishCross-bar analysis detecting declining deltaDefinitionAsk volume minus bid volume. Positive = more buying. Negative = more selling. Shows who is more aggressive. acceleration even as price continues. Early warning that trend participants are pulling back.
Institutional Patterns
Delta Slingshot
InstitutionalDramatic momentum reversal — extreme deltaDefinitionAsk volume minus bid volume. Positive = more buying. Negative = more selling. Shows who is more aggressive. builds in one direction then snaps back like a rubber band. Often occurs at session extremes after stop runs.
Delta Sweep
InstitutionalInstitutional entry clearing multiple thin (low-volume) price levels with strong, one-sided deltaDefinitionAsk volume minus bid volume. Positive = more buying. Negative = more selling. Shows who is more aggressive.. A sweep through an area of minimal resistance.
Delta Trap
InstitutionalPrice pulls back to trap counter-trend traders, then the original trend continues with conviction. The trap is confirmed by deltaDefinitionAsk volume minus bid volume. Positive = more buying. Negative = more selling. Shows who is more aggressive. reversing at the pullback extreme.
Delta Reversal
InstitutionalExtreme intrabar deltaDefinitionAsk volume minus bid volume. Positive = more buying. Negative = more selling. Shows who is more aggressive. swings in both directions — a tug-of-war climax. One side wins decisively by the bar's close. High-conviction turning point.
Delta Tail
InstitutionalA single bar showing contrary deltaDefinitionAsk volume minus bid volume. Positive = more buying. Negative = more selling. Shows who is more aggressive. at its extreme price. For example, strong selling at the very top of a bull bar — reveals hidden absorptionDefinitionHeavy aggressive orders hit a level but price doesn't move — a large passive player is absorbing the flow. and potential reversal.
Volume Sequencing
InstitutionalStaircase pattern of increasing volume at consecutive price levels. Institutional accumulation or distribution — smart money building a position methodically.
Market Sweep
NeutralMultiple consecutive thin-volume price levels. Indicates an area of minimal resistance — price can move quickly through these levels.
Stopping Volume
InstitutionalInstitutional volume that halts a move. Large passive orders absorb aggressive selling/buying and price stops moving despite high activity.
Auction & Profile Signals
Unfinished Auction
NeutralOpposing volume remains at a bar's extreme — buyers at the low or sellers at the high. The auction is incomplete and price is likely to revisit that level.
Thin Prints
NeutralPrice levels with very low volume. These represent levels of minimal interest — price tends to move quickly through thin areas.
POC in Wick
NeutralThe bar's Point of ControlDefinitionThe price level with the highest volume. Represents fair value — where the market attracted the most interest. (highest volume level) is in the wick rather than the body. Indicates price rejection — heavy trading occurred at a level that was subsequently rejected.
POC Gap
NeutralA gap between consecutive bars' Points of Control. Signals a shift in where the market considers fair value.
Continuous POC
NeutralAdjacent bars sharing the same POCDefinitionPoint of Control — the price with the highest volume. Where the most trading happened. price level. The market keeps returning to the same fair value — strong magnet level.
Profile Type
NeutralClassifies the volume distribution shape: P (bullish), b (bearish), D (balanced), B (bimodal/double distribution), T (trend), M (multi-distribution).
Session Volume Profile
NeutralAggregated volume at each price level for the full session. Shows the overall value area, POCDefinitionPoint of Control — the price with the highest volume. Where the most trading happened., VAHDefinitionValue Area High — the upper boundary of the zone where 70% of volume traded., and VAL for context.
Value Area
NeutralThe price range containing 70% of the session's volume. Prices inside the value area represent fair value; moves outside represent initiative activity.
TPO / Market Profile
In Volume Profile & Market Profile mode, the indicator renders TPO (Time Price Opportunity) charts alongside volume profiles. The following TPO features are configurable:
Display Styles
Letters
Classic TPO letters (A, B, C...) per time period
Split
Split profile with separate buy/sell sides
Heatmap
Color gradient based on time spent at each level
Blocks
Solid blocks with multiple style variants
Block Styles (when using Blocks display)
Classic
Traditional block profile
TradingView
TV-style color blocks
Mono
Single-color blocks
Heatmap
Gradient block heat
Session
Color by session period
Clean
Minimal, clean blocks
TPO Features
Initial Balance
The first 60 minutes of Regular Trading Hours (9:30-10:30 ET). Defines the opening range that often sets the day's tone.
IB Bracket
Visual bracket bar showing the Initial Balance range extending across the session.
Single Prints
Price levels with only one TPO. Extreme rejection zones that often act as future support/resistance.
Poor High / Poor Low
Session extremes with 2 or more TPOs — indicating a lack of conviction at the high or low. These levels tend to get revisited.
Naked Levels
Untested POC, VAH, or VAL from previous sessions. Price magnets that tend to eventually get revisited.
Composite Profile
Multi-session profile aggregating multiple days into a single view for longer-term context.
Day Type Classification
Automatically classifies each session as Neutral, Up Trend, Down Trend, or other types based on the profile structure.
Buying / Selling Tails
Excess TPOs extending beyond the main body of the profile. Buying tails push up from the bottom; selling tails push down from the top.
Session Types
24-Hour
Full globex session
NYSE
Regular trading hours only
Daily
Calendar day profile
Weekly
Full week composite
Monthly
Full month composite
Visible Range
Profile of currently visible chart area
Overnight Session
Split the overnight (Globex) session from RTH to see each auction independently. The overnight profile establishes its own Value Area, POC, and single prints — reference levels that set the stage for RTH. Right-click any session label to toggle split display, VA shading, and volume profile overlay.
TPO Right-Click Menu
Right-click any session label to toggle split display, VA shading, and volume profile overlay.
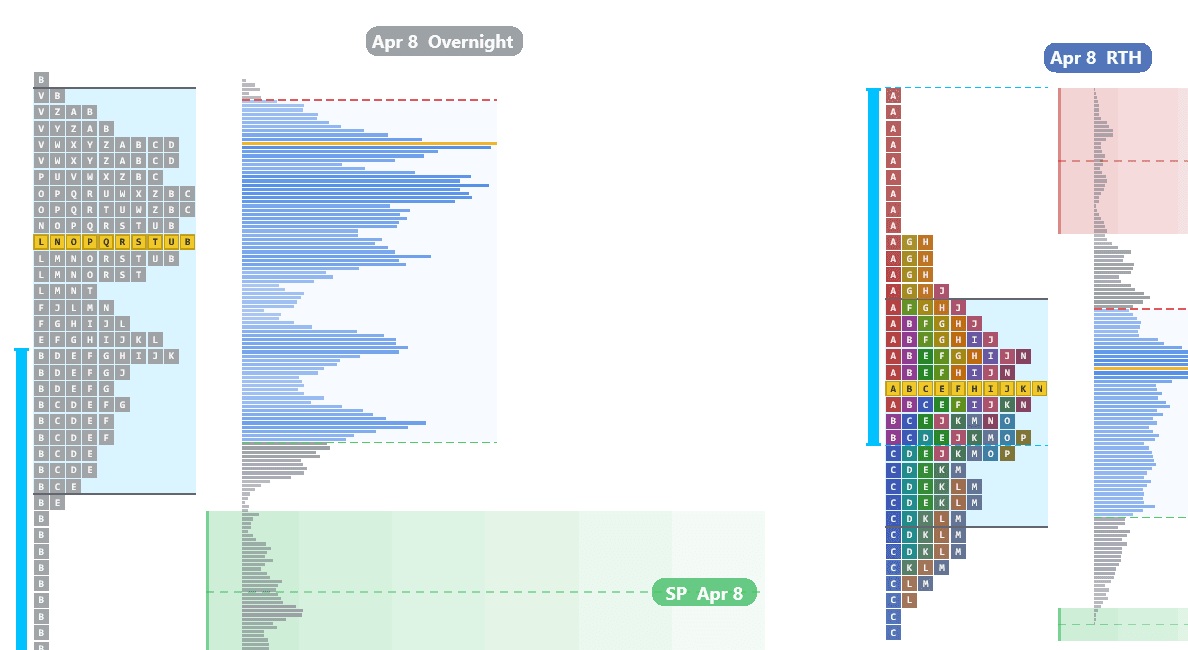
Overnight Single Print Bounce
Single prints left behind during the overnight auction act as support and resistance when RTH revisits those levels.
Footer Metrics
The footer row below each footprint bar displays configurable summary metrics. Each cell can be toggled on or off independently.
| Metric | Description |
|---|---|
| Bid/Ask Ratio | Ratio of total bid volume to total ask volume for the bar |
| Delta % | Net delta as a percentage of total volume |
| Delta Change | Absolute change in delta from the previous bar |
| Delta Change % | Percentage change in delta from the previous bar |
| Max Delta | Highest positive delta level in the bar |
| Min Delta | Lowest (most negative) delta level in the bar |
| Volume Change % | Percentage change in total volume from the previous bar |
| COT High | Commitment of Traders High — cumulative delta since the bar made its high. Shows if buyers or sellers dominated after the high was set. |
| COT Low | Commitment of Traders Low — cumulative delta since the bar made its low. Shows if buyers or sellers dominated after the low was set. |
| Cumulative Delta | Running total of (ask volume - bid volume) across the session |
| Buy Volume | Total ask-side (aggressive buy) volume for the bar |
| Sell Volume | Total bid-side (aggressive sell) volume for the bar |
| Max/Min Spread | Difference between max delta and min delta levels |
| Delta/Vol Ratio | Net delta divided by total volume. Measures how one-sided the bar's activity was. |
Footprint & Order Flow Glossary
- Ask (Buy Volume)
- Volume traded at the askDefinitionThe lowest price someone is currently willing to sell at. If you buy at market, this is what you pay. price. Represents aggressive buyers lifting the offer — they want in now and are willing to pay the higher price.
- Bid (Sell Volume)
- Volume traded at the bidDefinitionThe highest price someone is currently willing to pay to buy. If you sell at market, this is what you get. price. Represents aggressive sellers hitting the bid — they want out now and are willing to accept the lower price.
- Delta
- Ask volume minus bidDefinitionThe highest price someone is currently willing to pay to buy. If you sell at market, this is what you get. volume at a single price level or for an entire bar. Positive deltaDefinitionAsk volume minus bid volume. Positive = more buying. Negative = more selling. Shows who is more aggressive. = more aggressive buying. Negative delta = more aggressive selling.
- Cumulative Delta
- Running total of deltaDefinitionAsk volume minus bid volume. Positive = more buying. Negative = more selling. Shows who is more aggressive. across the session. Tracks the overall balance between aggressive buyers and sellers from the session open.
- Net Delta
- Total askDefinitionThe lowest price someone is currently willing to sell at. If you buy at market, this is what you pay. volume minus total bidDefinitionThe highest price someone is currently willing to pay to buy. If you sell at market, this is what you get. volume for a single bar. The overall buying/selling pressure summary for that bar.
- Point of Control (POC)
- The price level with the highest total volume (bidDefinitionThe highest price someone is currently willing to pay to buy. If you sell at market, this is what you get. + askDefinitionThe lowest price someone is currently willing to sell at. If you buy at market, this is what you pay.) in a bar or session. Represents fair value — where the most business was transacted.
- Value Area High (VAH)
- The upper boundary of the price range containing 70% of the session's volume. Price above VAHDefinitionValue Area High — the upper boundary of the zone where 70% of volume traded. is considered 'expensive' relative to the session's value.
- Value Area Low (VAL)
- The lower boundary of the 70% volume range. Price below VALDefinitionValue Area Low — the lower boundary of the zone where 70% of volume traded. is considered 'cheap' relative to the session's value.
- Diagonal Imbalance
- A comparison of askDefinitionThe lowest price someone is currently willing to sell at. If you buy at market, this is what you pay. volume at one price to bidDefinitionThe highest price someone is currently willing to pay to buy. If you sell at market, this is what you get. volume at the price below (for buy imbalancesDefinitionA price level where one side overwhelms the other by 3:1 or more. Shows where big players committed.) or bid volume at one price to ask volume above (for sell imbalances). The default threshold is 300% — one side must be 3x the other.
- Stacked Imbalance
- Three or more consecutive diagonal imbalancesDefinitionA price level where one side overwhelms the other by 3:1 or more. Shows where big players committed. in the same direction. Represents sustained institutional aggression across multiple price levels.
- Absorption
- When large passive limit orders soak up aggressive market orders without letting price move. High volume at a level with no price continuation indicates a large player defending that price.
- Exhaustion
- A bar pushes to a new extreme but shows no meaningful volume at the extreme price levels. The move has run out of participants. Classic precursor to reversal.
- Unfinished Auction
- Remaining opposing volume at a bar's extreme. Buyers at the low or sellers at the high suggest the auction is not complete and price will likely return.
- Thin Prints
- Price levels with very little volume. Price moved through quickly with minimal resistance. These areas tend to get re-auctioned.
- TPO (Time Price Opportunity)
- A single unit of time spent at a single price level. In market profile, each 30-minute period is assigned a letter (A, B, C...) and placed at every price traded during that period.
- Initial Balance (IB)
- The price range established during the first hour of regular trading hoursDefinition9:30 AM to 4:00 PM ET — when the NYSE is open and most of the day's volume happens. (typically 9:30-10:30 ET). The IBDefinitionInitial Balance — the price range of the first hour of regular trading. Sets the day's reference range. sets the day's reference range and often defines the day's trading type.
- Single Prints
- TPODefinitionTime Price Opportunity — a letter printed at each price level per 30-minute period on a Market Profile chart. levels with only one letter — indicating price moved through quickly. These zones act as support/resistance because they represent areas of rejection.
- Poor High / Poor Low
- A session extreme where multiple TPOsDefinitionTime Price Opportunity — a letter printed at each price level per 30-minute period on a Market Profile chart. (2+) formed. Indicates the extreme was not rejected with conviction and is likely to be revisited.
- Naked Level
- A POCDefinitionPoint of Control — the price with the highest volume. Where the most trading happened., VAHDefinitionValue Area High — the upper boundary of the zone where 70% of volume traded., or VAL from a previous session that has not yet been tested by subsequent price action. Acts as a price magnet.
- COT (Commitment of Traders)
- In this context: cumulative deltaDefinitionRunning total of buying vs selling across the session. Shows who has been in control overall. measured from the point a bar sets its high or low. COT High shows delta since the bar's high was made. COT Low shows delta since the bar's low.
- Volume Profile
- Horizontal histogram showing total volume traded at each price level for a session or time period. Unlike time-based charts, volume profile shows where volume actually occurred.
- Profile Type
- Classification of the volume distribution shape: P (bullish, volume at top), b (bearish, volume at bottom), D (balanced), B (bimodal/double distribution), T (trend), M (multi-distribution with 3+ peaks).
- Tick Aggregation
- Combining multiple tick-level price rows into a single displayed row. Useful for smoothing noisy data on volatile instruments. A setting of 2 combines every 2 ticks into one row.
- Composite Profile
- A volume or TPODefinitionTime Price Opportunity — a letter printed at each price level per 30-minute period on a Market Profile chart. profile aggregated across multiple sessions. Provides longer-term context about value areas and points of control beyond a single day.
- Range Bar
- A bar type where each bar represents a fixed price range (e.g., 4 ticks) rather than a fixed time period. Preferred for footprintDefinitionA chart showing bid and ask volume at every price inside each candle. Reveals who is buying and selling. analysis because each bar captures meaningful price movement.
- Iceberg Order
- A large institutional order that is only partially displayed in the order book. The full size is hidden and refills as it gets hit. Often detected via absorptionDefinitionHeavy aggressive orders hit a level but price doesn't move — a large passive player is absorbing the flow. patterns.
Settings Reference
| Setting | Default | Description |
|---|---|---|
| IndicatorMode | FootPrint | Select operating mode: Footprint, VP + Market Profile, or VP + Cumulative Delta |
Need help?
If you have questions about the indicator or need help with configuration, reach out to our support team.
Contact Support