What Is a Composite Profile?
A composite profileDefinitionMultiple sessions combined into one profile. Composite POCs and Value Areas carry more weight than single sessions. combines multiple sessions into a single profile. Instead of looking at one day's TPODefinitionTime Price Opportunity — a letter printed at each price level per 30-minute period on a Market Profile chart. or volume distributionDefinitionPhase 3 of Power of 3. The real move — Smart Money distributes into retail momentum., you stack several days (or weeks) together to see the bigger picture.

A single session profile tells you what happened today. A composite profileDefinitionMultiple sessions combined into one profile. Composite POCs and Value Areas carry more weight than single sessions. tells you what the market has been agreeing on across many days. The composite levels carry far more weight because they represent sustained institutional consensus.
Why Composite Profiles Matter
- Single-session levels are useful but temporary — they get replaced by the next day's levels
- Composite levels persist — a POCDefinitionPoint of Control — the price with the highest volume. Where the most trading happened. that holds across 5 days of trading is far more significant than a single-day POC
- Institutional traders think in terms of weeks and months, not single sessions
- Composite profilesDefinitionMultiple sessions combined into one profile. Composite POCs and Value Areas carry more weight than single sessions. reveal the structural levels that the market truly respects
Value Area Migration
One of the most powerful uses of multi-day analysis is tracking how the daily Value AreaDefinitionThe price range where 70% of volume traded. Defined by Value Area High (VAH) and Value Area Low (VAL). shifts from session to session:
- Value AreaDefinitionThe price range where 70% of volume traded. Defined by Value Area High (VAH) and Value Area Low (VAL). migrating higher — each day's VA is higher than the previous day's VA. This is a healthy uptrend. Buyers are accepting higher and higher prices
- Value AreaDefinitionThe price range where 70% of volume traded. Defined by Value Area High (VAH) and Value Area Low (VAL). migrating lower — each day's VA is lower than the previous day's VA. Healthy downtrend. Sellers are pushing value down
- Overlapping Value Areas — today's VA overlaps significantly with yesterday's. The market is in balance. No clear direction until one side breaks free
- VA gap up or gap down — today's VA has no overlap with yesterday's. The market repriced overnight. Watch for acceptance (continuation) or rejection (gap fill)
Value AreaDefinitionThe price range where 70% of volume traded. Defined by Value Area High (VAH) and Value Area Low (VAL). migration is the simplest multi-day signal in profile analysis. If each day's Value Area is higher than the last, you are in an uptrend. If they overlap, you are in balance. If they are stepping lower, you are in a downtrend. It does not get simpler than that.
Here is a real MNQDefinitionMicro E-mini Nasdaq 100 — 1/10th the size of NQ. 1 tick = $0.50, 1 point = $2. Fast moves, beginner-sized risk. 5-minute footprint chartDefinitionA chart showing bid and ask volume at every price inside each candle. Reveals who is buying and selling. showing value area migration lower. Each session's value area steps down from the previous one — the POCDefinitionPoint of Control — the price with the highest volume. Where the most trading happened. (magenta line) migrates lower with every session. Delta is consistently negative across the board, with cumulative deltaDefinitionRunning total of buying vs selling across the session. Shows who has been in control overall. building to the downside. This is what a healthy downtrend looks like through the lens of profile analysis — sellers are pushing accepted value lower session after session.
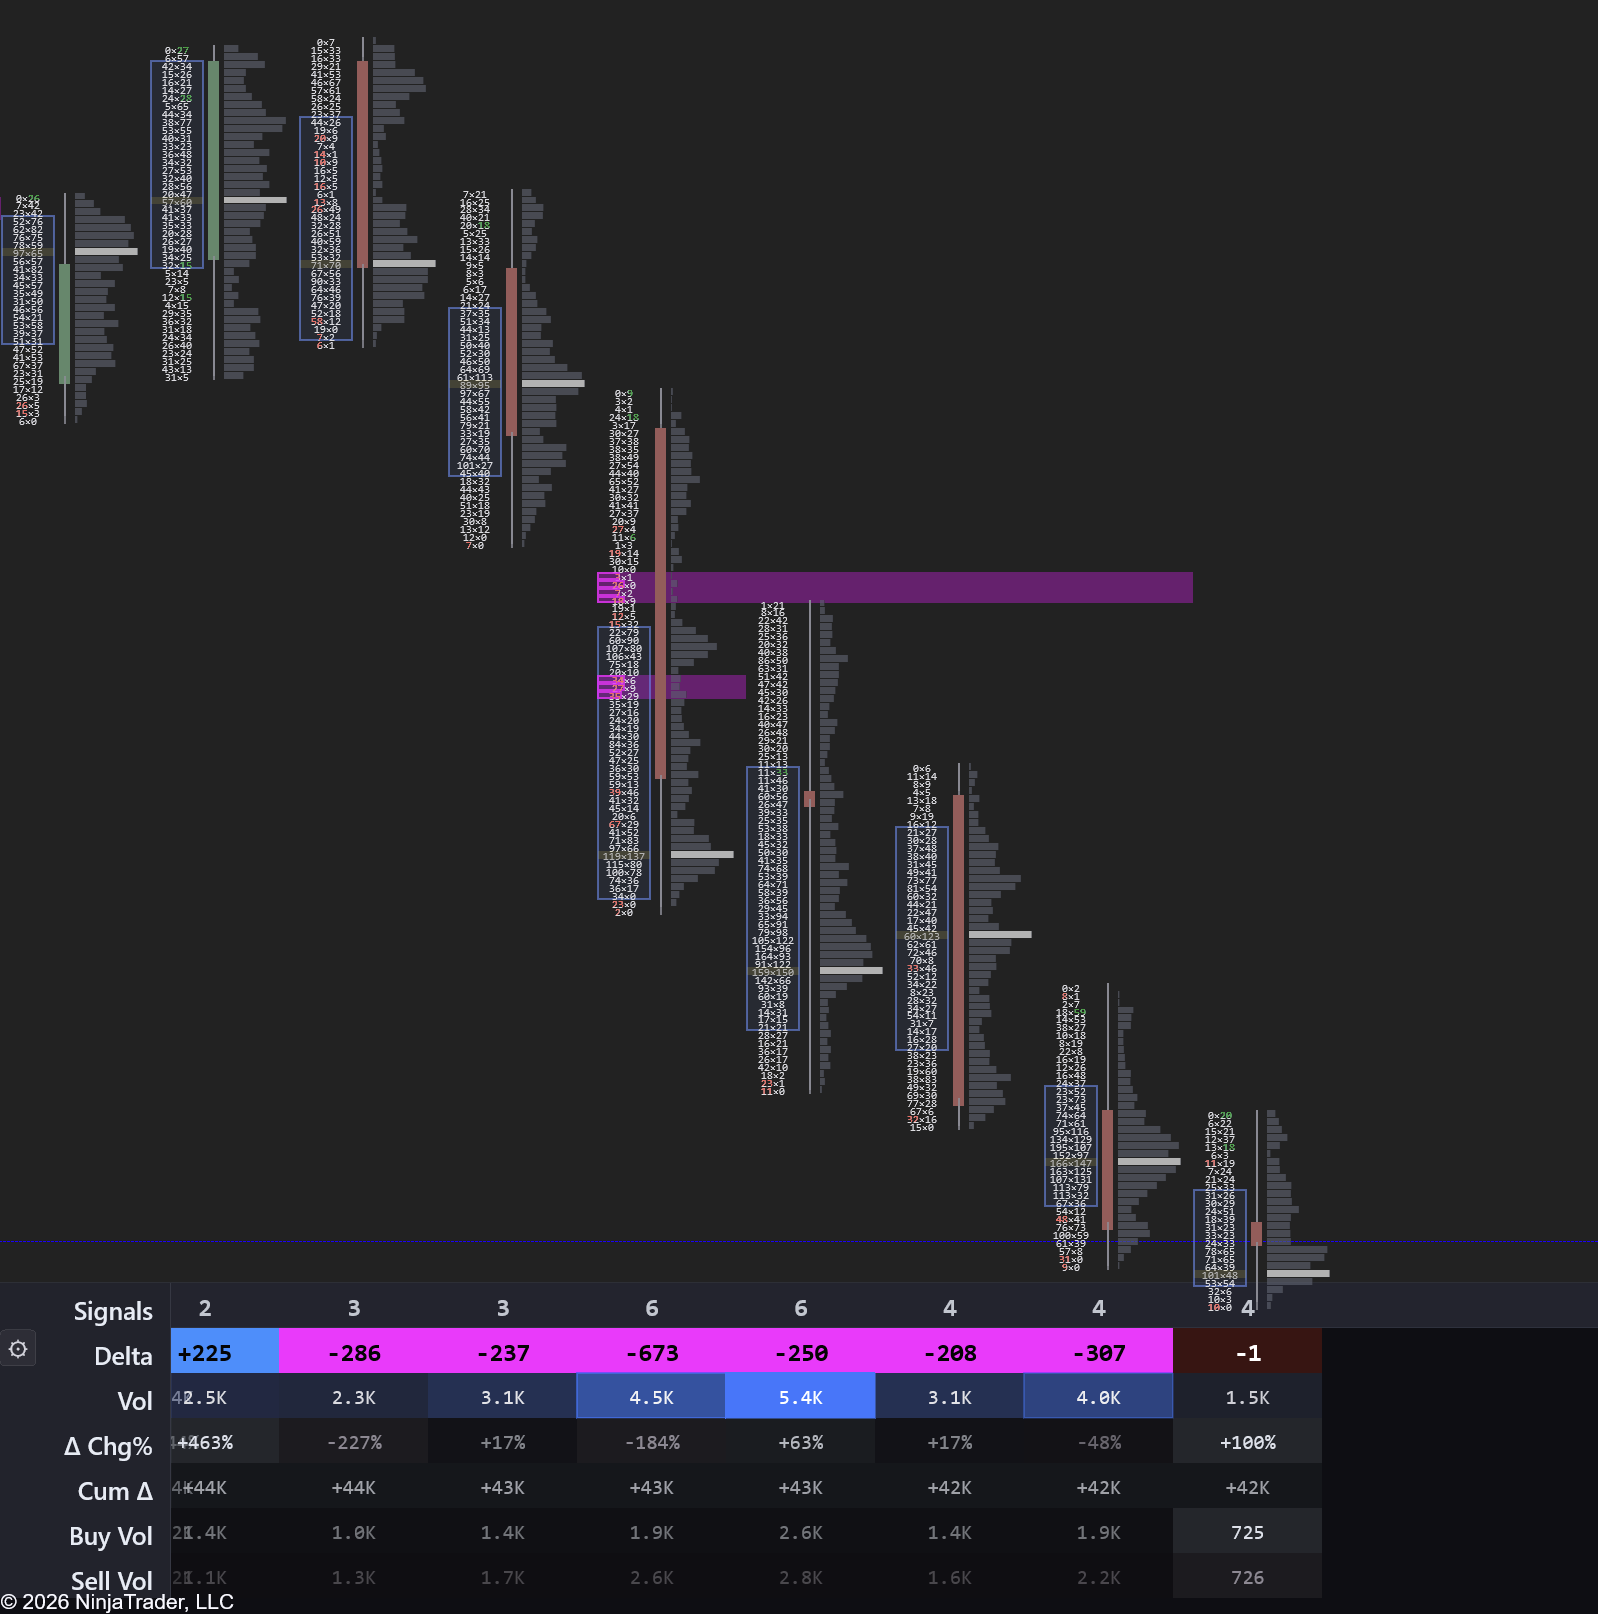
Our OrderFlow Indicator plots session volume profiles with POCDefinitionPoint of Control — the price with the highest volume. Where the most trading happened., VAHDefinitionValue Area High — the upper boundary of the zone where 70% of volume traded. Acts as resistance., and VALDefinitionValue Area Low — the lower boundary of the zone where 70% of volume traded. Acts as support. automatically — making value area migration visible at a glance across your chart.
Naked POCs
A naked POCDefinitionPrior-session POCs that price never retested. Act as magnets — price tends to come back to them. is a prior session's Point of ControlDefinitionThe price level with the highest volume. Represents fair value — where the market attracted the most interest. that price has never revisited since it was created.
- Naked POCsDefinitionPrior-session POCs that price never retested. Act as magnets — price tends to come back to them. are magnets — the market tends to return to them eventually
- They represent unfinished business — the market accepted that price as fair value but never went back to confirm it
- The older the naked POCDefinitionPrior-session POCs that price never retested. Act as magnets — price tends to come back to them., the stronger the magnet — a 3-day-old naked POC is interesting, a 2-week-old naked POC is significant
- Mark naked POCsDefinitionPrior-session POCs that price never retested. Act as magnets — price tends to come back to them. on your chart and watch for reactions when price finally reaches them
- This concept is closely related to unfinished business on the footprint chartDefinitionA chart showing bid and ask volume at every price inside each candle. Reveals who is buying and selling.
Developing vs Settled Profiles
- Developing profile — the session is still in progress. The shape, POCDefinitionPoint of Control — the price with the highest volume. Where the most trading happened., and Value AreaDefinitionThe price range where 70% of volume traded. Defined by Value Area High (VAH) and Value Area Low (VAL). are shifting as new data comes in. Useful for real-time analysis but subject to change
- Settled profile — the session is complete. The final shape, POCDefinitionPoint of Control — the price with the highest volume. Where the most trading happened., and VA are fixed. These are the levels you use for reference in future sessions
- During a session, watch how the developing POCDefinitionPoint of Control — the price with the highest volume. Where the most trading happened. migrates — if it keeps moving higher, the market is accepting higher value in real-time. If it is stuck at one price while the market makes new highs, the move lacks volume confirmation
The developing profile is your real-time read on market acceptance. Watch the POCDefinitionPoint of Control — the price with the highest volume. Where the most trading happened.. If it is migrating with price, the move is real. If it is stuck while price extends, the extension is likely to fail and price will return to where the volume actually is.