Market ProfileDefinitionA chart format using TPO letters to show how long price traded at each level. Reveals the shape of the auction. is a charting method created by J. Peter Steidlmayer at the Chicago Board of Trade. It organizes price data by time to show you where the market spent the most time — and where it moved through quickly. Instead of plotting candles, it plots letters.
Market ProfileDefinitionA chart format using TPO letters to show how long price traded at each level. Reveals the shape of the auction. answers a different question than a candlestick chart. Candlesticks askDefinitionThe lowest price someone is currently willing to sell at. If you buy at market, this is what you pay. "where did price go?" Market Profile asks "where did price stay?" The distinction matters because where price stays is where value is accepted.
TPO: Time Price Opportunity
TPODefinitionTime Price Opportunity — a letter printed at each price level per 30-minute period on a Market Profile chart. stands for Time Price Opportunity. Each 30-minute period during the session is assigned a letter:
- A period = first 30 minutes of the session
- B period = second 30 minutes
- C, D, E, F, G, H and so on through the day
- Each letter is placed at every price level the market touched during that 30-minute window
- Letters stack horizontally at each price — the wider the row, the more time spent there
The widest row — where the most letters stacked up — is the POC (Point of Control). That is the price the market accepted as fair value for the session.

Single Prints
A single printDefinitionPrice levels with only one TPO letter — price moved through quickly. Often act as support or resistance on retest. is a price level where only one letter appears — meaning the market visited that price during only one 30-minute period and never came back.
- Single printsDefinitionPrice levels with only one TPO letter — price moved through quickly. Often act as support or resistance on retest. represent initiative activity — one side drove price through that zone aggressively
- They often appear in the middle of a profile between two clusters of volume
- Single printsDefinitionPrice levels with only one TPO letter — price moved through quickly. Often act as support or resistance on retest. act as support and resistance when price revisits them
- A column of single printsDefinitionPrice levels with only one TPO letter — price moved through quickly. Often act as support or resistance on retest. separating two value areas signals a market that repriced quickly

Poor Highs and Poor Lows
A poor highDefinitionProfile high with multiple TPOs but no single-print tail. Auction incomplete — price tends to revisit. or poor lowDefinitionProfile low with multiple TPOs but no single-print tail. Auction incomplete — price tends to revisit. is a profile extreme that lacks a single-print tail.
- Poor highDefinitionProfile high with multiple TPOs but no single-print tail. Auction incomplete — price tends to revisit. — the top of the profile has multiple letters at the high price, not a clean single-print rejection. Buyers were not decisively rejected. The auction is incomplete
- Poor lowDefinitionProfile low with multiple TPOs but no single-print tail. Auction incomplete — price tends to revisit. — the bottom of the profile has multiple letters at the low price. Sellers were not decisively rejected. The auction is incomplete
- Poor highsDefinitionProfile high with multiple TPOs but no single-print tail. Auction incomplete — price tends to revisit. and poor lowsDefinitionProfile low with multiple TPOs but no single-print tail. Auction incomplete — price tends to revisit. are magnets — price tends to revisit them to complete the unfinished auction
- Compare this to unfinished business on the footprint chartDefinitionA chart showing bid and ask volume at every price inside each candle. Reveals who is buying and selling. — same concept, different lens
A clean high or low has a single-print tail — the market poked into that extreme once and got rejected hard. A poor highDefinitionProfile high with multiple TPOs but no single-print tail. Auction incomplete — price tends to revisit. or low means rejection never happened. Expect price to come back and test it.

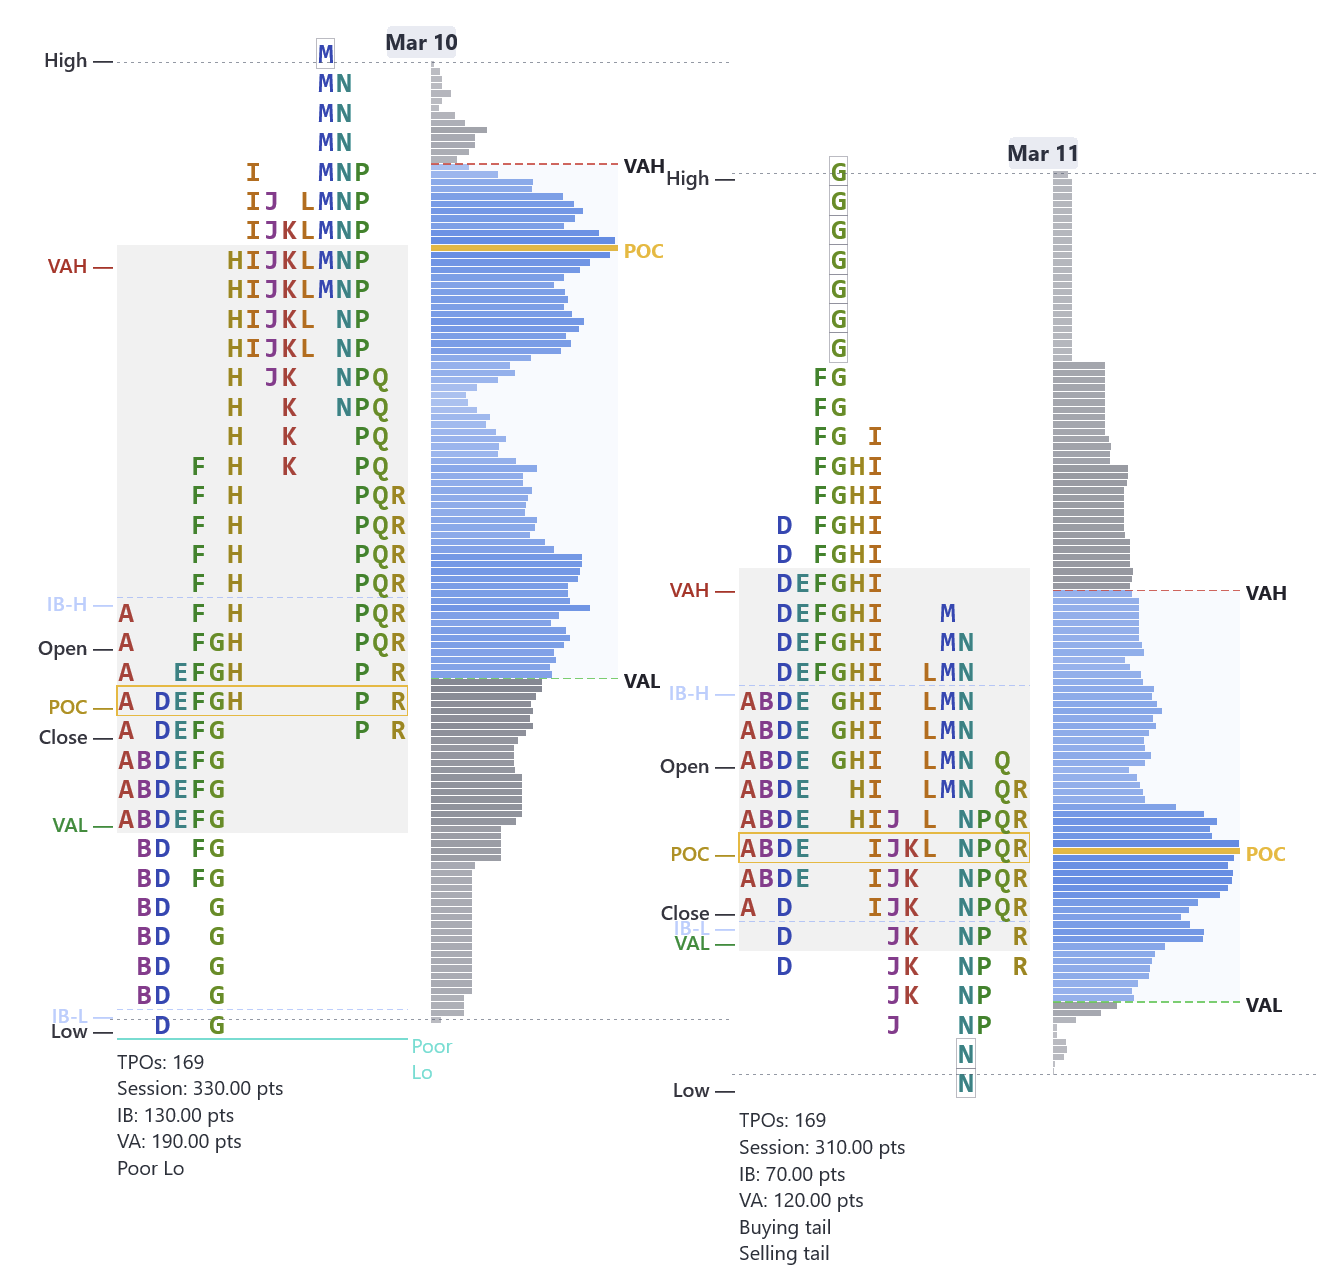
Here is a real MNQDefinitionMicro E-mini Nasdaq 100 — 1/10th the size of NQ. 1 tick = $0.50, 1 point = $2. Fast moves, beginner-sized risk. example. March 10 closes with a poor lowDefinitionProfile low with multiple TPOs but no single-print tail. Auction incomplete — price tends to revisit. — multiple letters stacked at the bottom with no clean single-print rejection. The next session (March 11) opens near the prior day's VALDefinitionValue Area Low — the lower boundary of the zone where 70% of volume traded. Acts as support. and rallies up to test it, but gets rejected. Price drops back down to revisit the poor low from the prior session. The unfinished auction acted as a magnet, pulling price back to complete the job.
Our OrderFlow Indicator automatically labels poor highsDefinitionProfile high with multiple TPOs but no single-print tail. Auction incomplete — price tends to revisit. and poor lowsDefinitionProfile low with multiple TPOs but no single-print tail. Auction incomplete — price tends to revisit. on your TPODefinitionTime Price Opportunity — a letter printed at each price level per 30-minute period on a Market Profile chart. profile, so you never miss an unfinished auction.
Excess (Tails)
ExcessDefinitionSingle-print TPOs at the top or bottom of a profile — aggressive rejection. Shows the auction was completed. is the opposite of a poor highDefinitionProfile high with multiple TPOs but no single-print tail. Auction incomplete — price tends to revisit. or poor lowDefinitionProfile low with multiple TPOs but no single-print tail. Auction incomplete — price tends to revisit.. It shows up as a single-print tail at the top or bottom of the profile.
- ExcessDefinitionSingle-print TPOs at the top or bottom of a profile — aggressive rejection. Shows the auction was completed. at the high = sellers rejected buyers with conviction. Healthy sign in a downtrend
- ExcessDefinitionSingle-print TPOs at the top or bottom of a profile — aggressive rejection. Shows the auction was completed. at the low = buyers rejected sellers with conviction. Healthy sign in an uptrend
- The longer the tail (more single printsDefinitionPrice levels with only one TPO letter — price moved through quickly. Often act as support or resistance on retest.), the stronger the rejection
- ExcessDefinitionSingle-print TPOs at the top or bottom of a profile — aggressive rejection. Shows the auction was completed. tells you the auction at that extreme is complete — price does not need to revisit

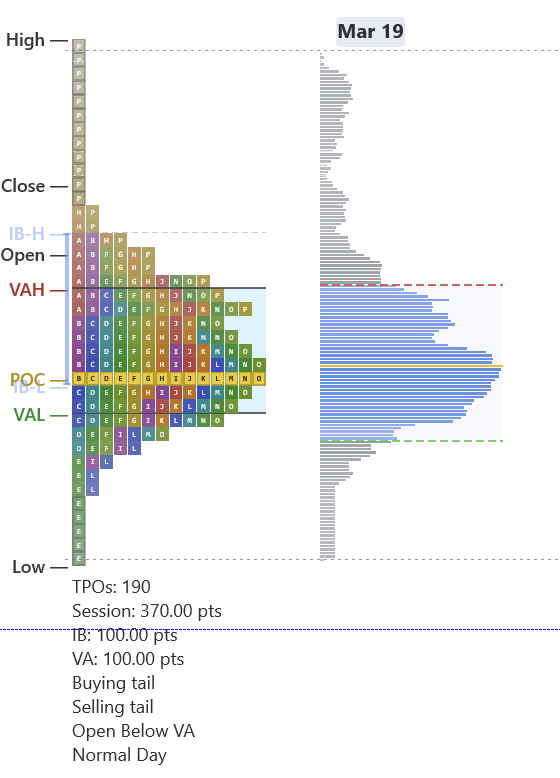
Here is a real MNQDefinitionMicro E-mini Nasdaq 100 — 1/10th the size of NQ. 1 tick = $0.50, 1 point = $2. Fast moves, beginner-sized risk. example from March 19. This session has both a selling tail at the high and a buying tail at the low — clean single-print extremes on both ends. The P-period letters at the top were never revisited, showing sellers rejected buyers decisively. At the bottom, the early E-period letters form a clean tail where buyers stepped in hard. Both tails confirm the auction was completed at each extreme — no reason for price to revisit either end.
Our OrderFlow Indicator automatically detects and labels buying tails and selling tails on your TPODefinitionTime Price Opportunity — a letter printed at each price level per 30-minute period on a Market Profile chart. profile, so you can instantly see where the auction completed.
TPO vs Volume
Market ProfileDefinitionA chart format using TPO letters to show how long price traded at each level. Reveals the shape of the auction. (TPODefinitionTime Price Opportunity — a letter printed at each price level per 30-minute period on a Market Profile chart.) and Volume Profile measure different things:
- TPODefinitionTime Price Opportunity — a letter printed at each price level per 30-minute period on a Market Profile chart. counts time at price — how many 30-minute periods touched each level
- Volume ProfileDefinitionA histogram showing total volume at each price level. The widest bar is the POC. Shows where the heaviest trading occurred. counts contracts at price — how many contracts traded at each level
- When both POCs align (time and volume agree on fair value), the level is very strong
- When they diverge, it signals that volume concentrated at a different price than where time was spent — often an early clue that value is migrating
TPODefinitionTime Price Opportunity — a letter printed at each price level per 30-minute period on a Market Profile chart. shows you where the market chose to spend time. Volume shows you where traders committed capital. When both agree on the same level, that is the strongest reference point on the chart.