Built for NinjaTrader 8
One auction. Two lenses.
Two native indicators for the same chart. Flip the lens and read the tape as order flow — or market structure.
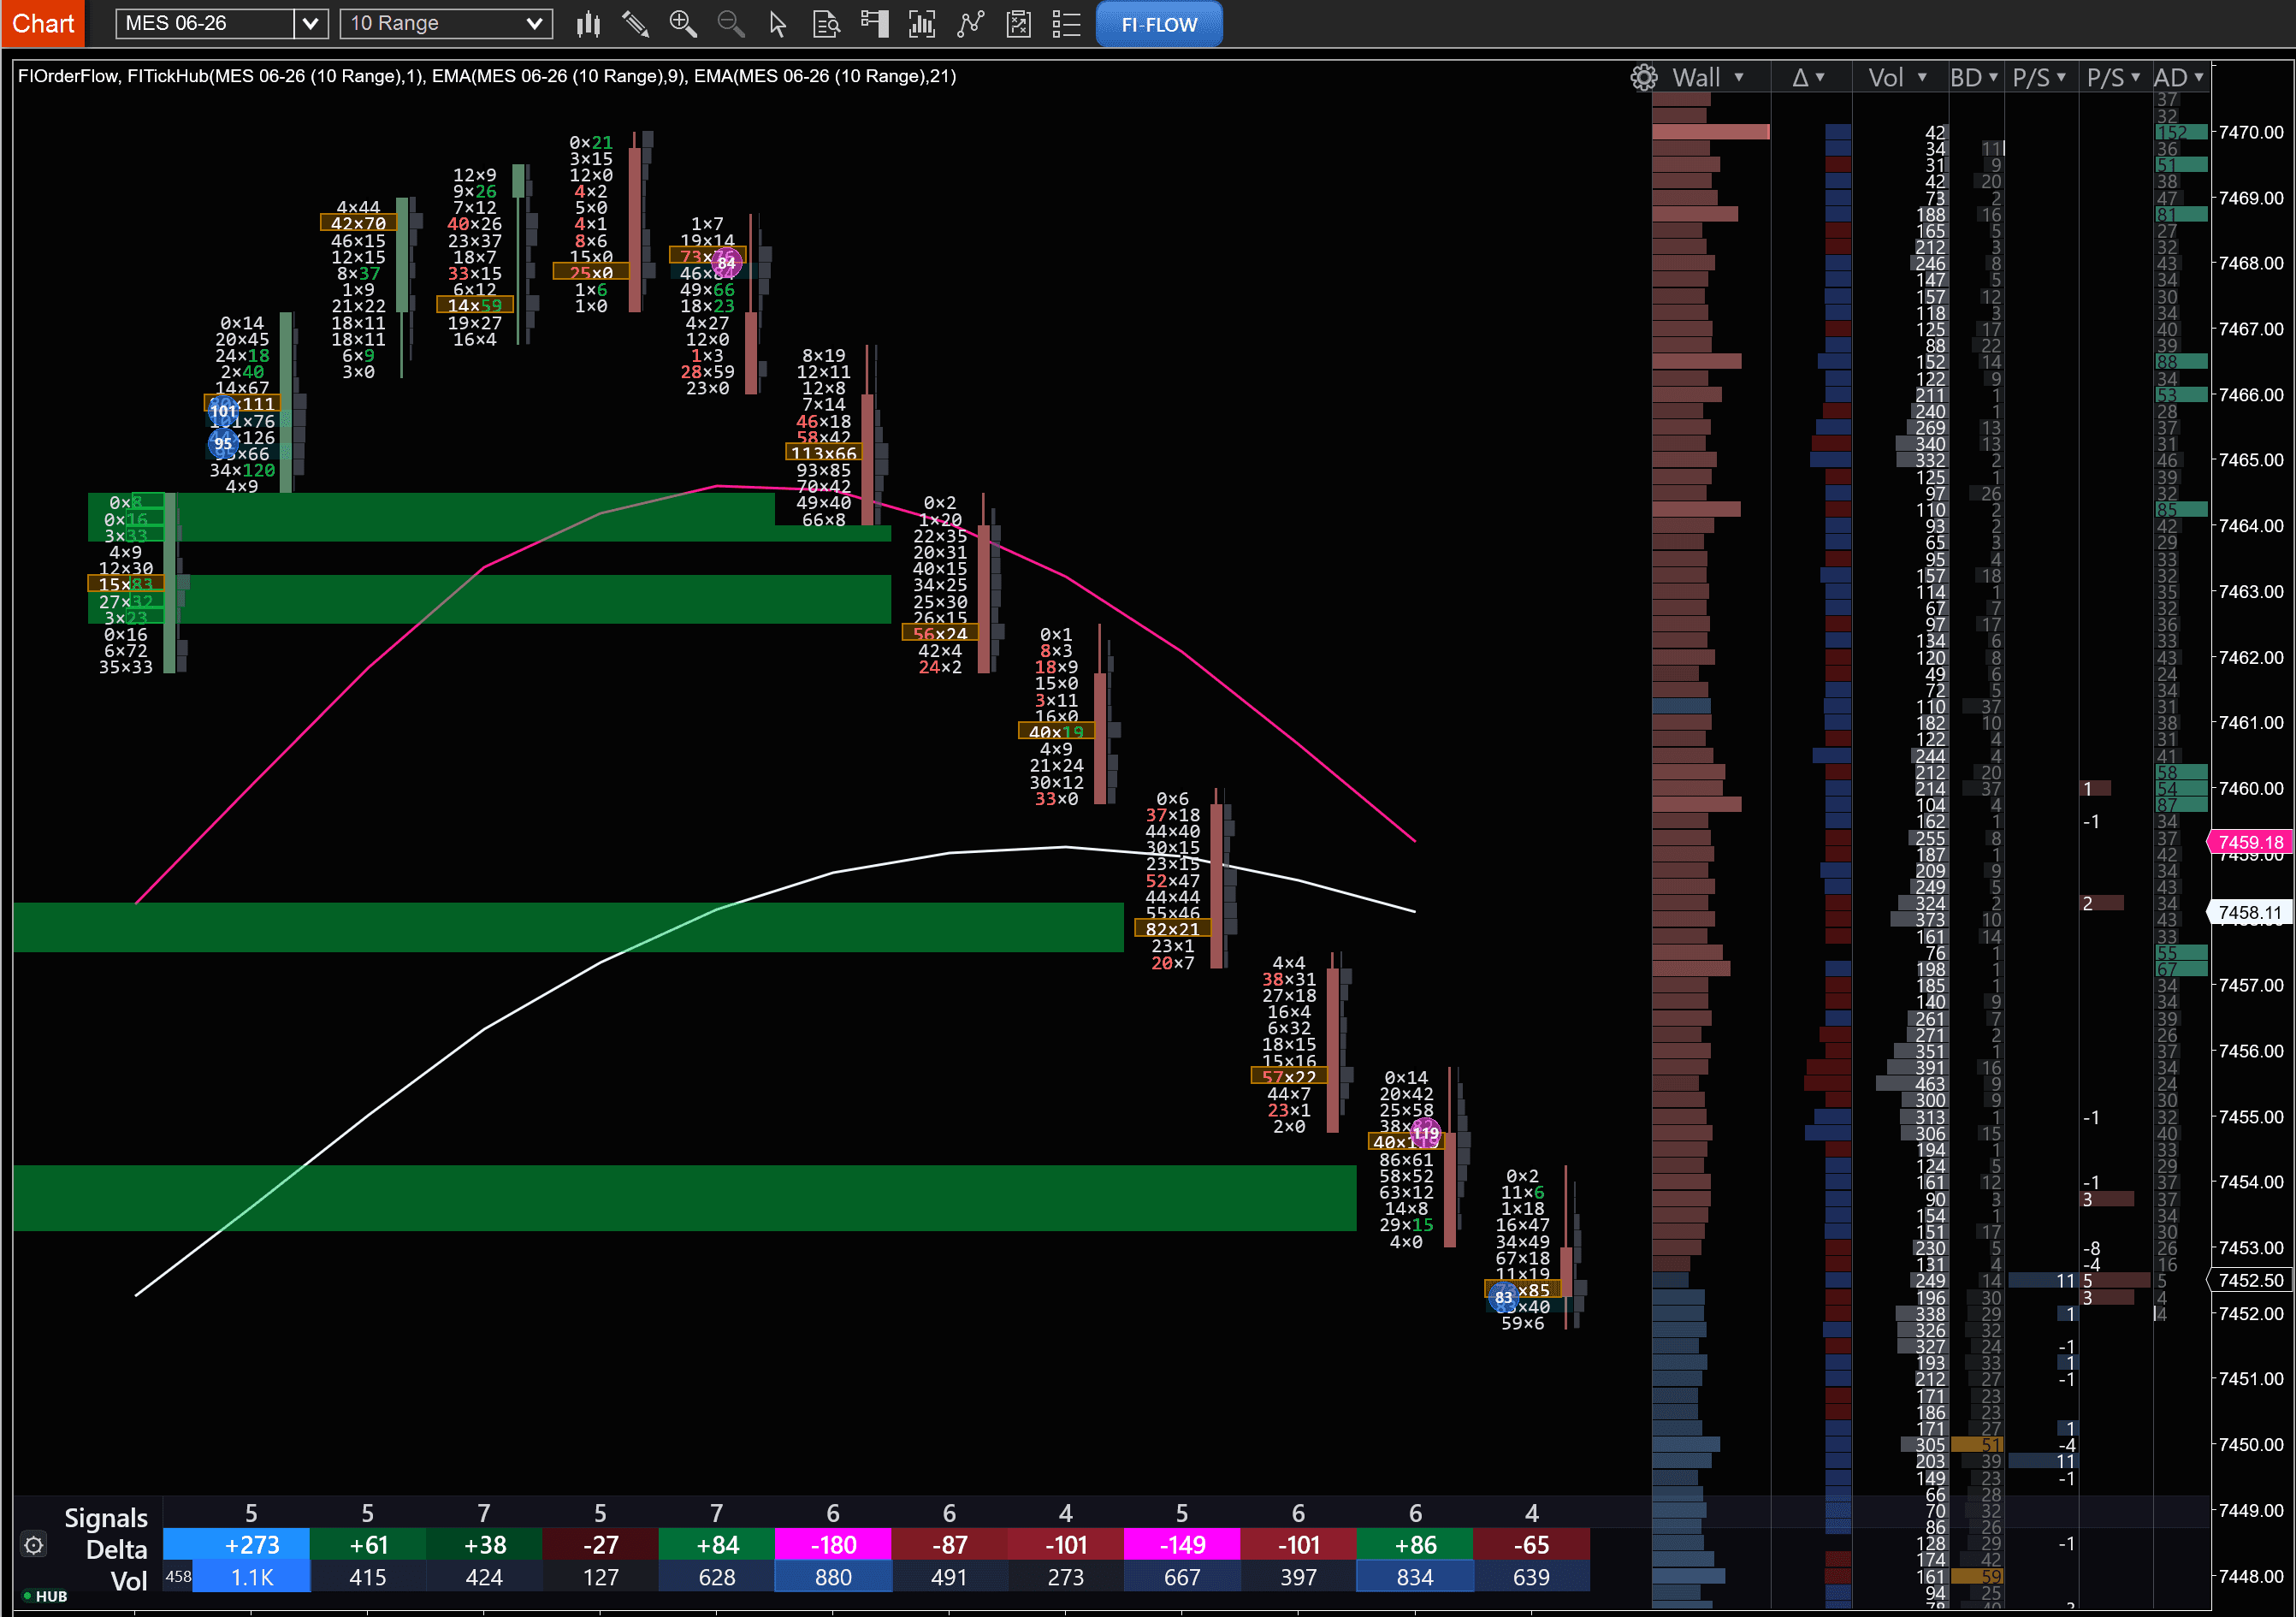
FIOrderFlow — Footprint, inline DOM, volume profile, Market Profile, cumulative delta, delta bars and a new Liquidity Visualizer — plus a built-in Auto Trader — in real time.
Footprint rendering · measured live
Why another footprint?
Because there's a high probability you're 200 milliseconds behind actual price. We measured footprint rendering lag on live MNQ tape, frame by frame — and ours shines above all others. Press play and see for yourself.
Watch it in action
Real sessions and full walkthroughs — footprint, DOM and market structure on live charts, straight from our channel.
Two indicators
Pick what you want to see.
Each runs native in NinjaTrader 8, with a free 5-day trial. Start with the one that fits how you trade.
OrderFlow
See the order flow.
Footprint cells, inline DOM, cumulative delta, volume & delta profiles, a full Market Profile and a Bookmap-style Liquidity Visualizer — plus a built-in Auto Trader — all on one pane, rendered at 30+ FPS even on the fastest tape.
No credit card required. Full access for 5 days.
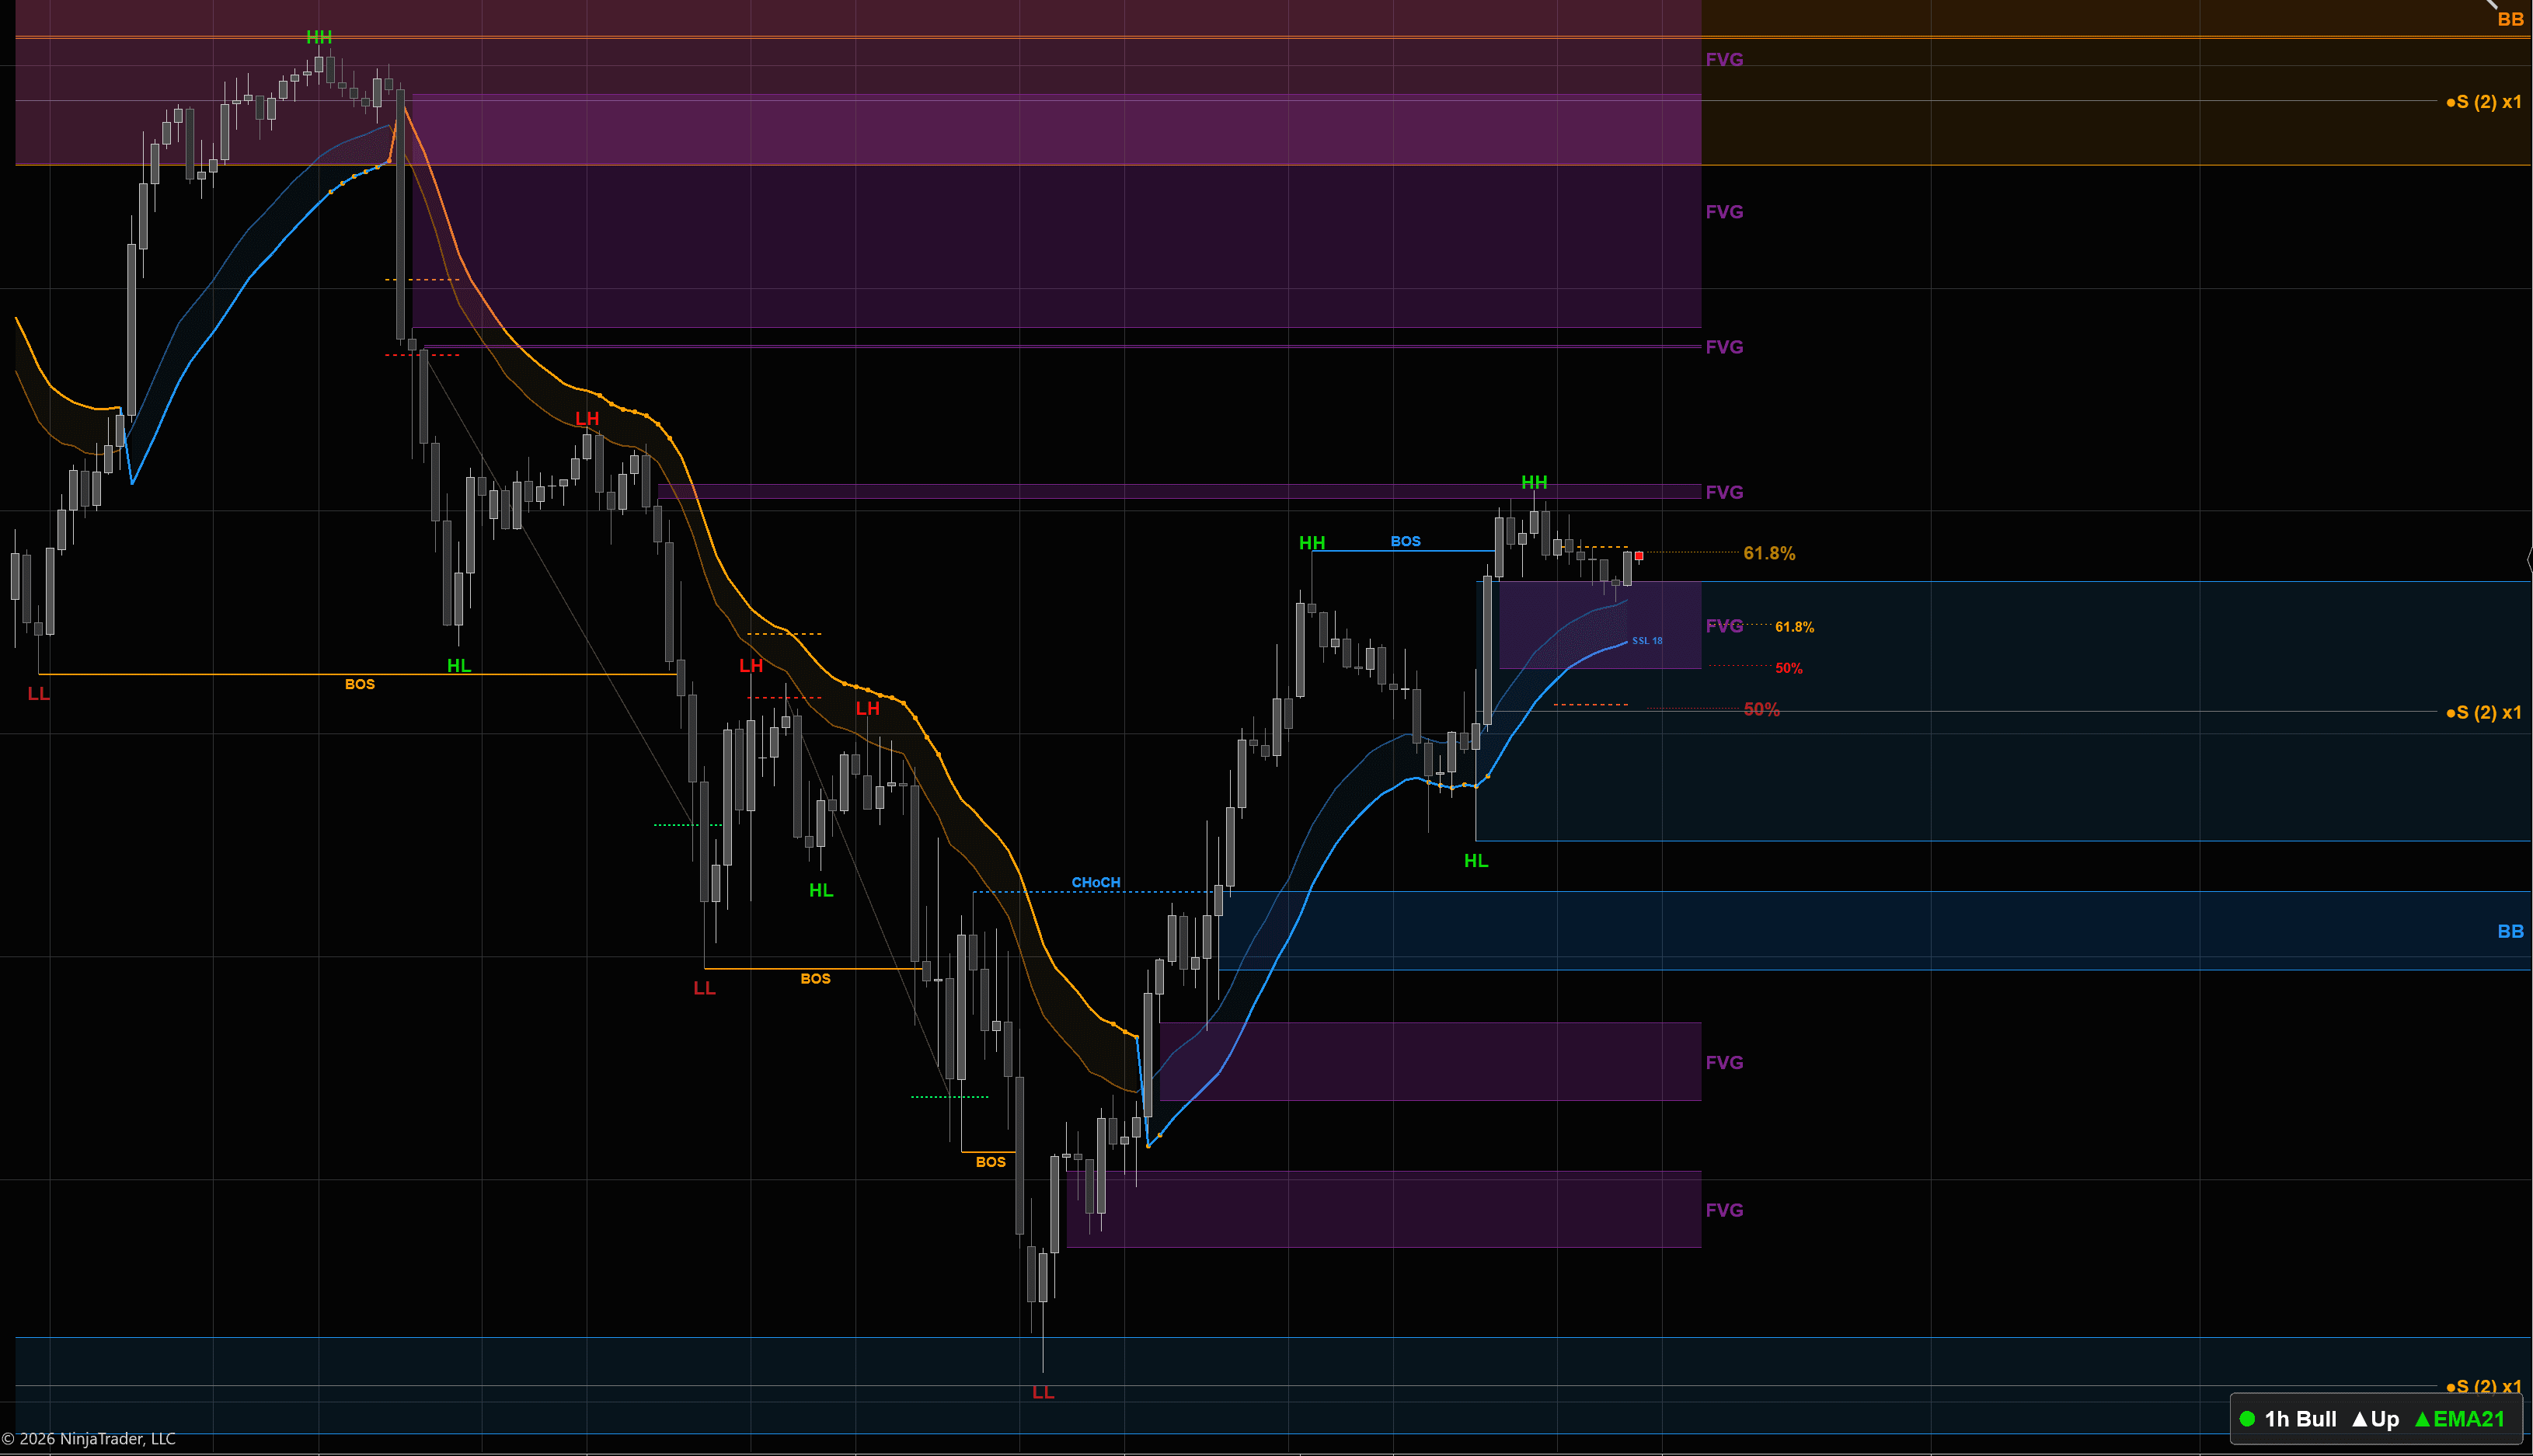
Market Structure
See the structure.
CHoCH, BOS, swing structure, Opening Range, Initial Balance, and daily & weekly levels — auto-plotted bar-for-bar, no repaint. One indicator instead of the six you stack today.
No credit card required. Full access for 5 days.
Official NinjaTrader Vendor · No credit card
Fast enough to keep up with the tape.
Footprint cells, imbalances and delta painted as they print — measured 30+ FPS through the fastest tape.
Footprint, inline DOM, cumulative delta, volume & delta profiles, Market Profile and a Liquidity Visualizer — plus a built-in Auto Trader — on a single chart.
Structure and levels plot as the candle closes and stay put — live and in review.
Full walkthrough
See it all on one chart.
A complete NinjaTrader walkthrough of both indicators — market structure (CHoCH, BOS, ranges & levels) and order flow (footprint, inline DOM, Liquidity Visualizer, cumulative delta, TPO & Market Profile) — read live, bar by bar.
How the trial works
From sign-up to live chart in three steps.
Create a free account
Email only — no credit card, no sales call. Under a minute.
Get your license key
Issued instantly, right after you verify your email.
Activate in NinjaTrader
Drop the key into NinjaTrader 8 for full access. Your five days start when you do.
Official NinjaTrader Vendor

See it on your own charts.
Run an indicator live in NinjaTrader 8 for five days — free, no credit card.