Open Type Analysis
Where price opens relative to the prior session's Value AreaDefinitionThe price range where 70% of volume traded. Defined by Value Area High (VAH) and Value Area Low (VAL). is one of the most important signals in Market ProfileDefinitionA chart format using TPO letters to show how long price traded at each level. Reveals the shape of the auction. trading. It sets the tone for the entire session.

- Open inside prior VA — the market is accepting yesterday's value. Expect rotation and balance until price breaks above the VAHDefinitionValue Area High — the upper boundary of the zone where 70% of volume traded. Acts as resistance. or below the VALDefinitionValue Area Low — the lower boundary of the zone where 70% of volume traded. Acts as support.
- Open above prior VAHDefinitionValue Area High — the upper boundary of the zone where 70% of volume traded. Acts as resistance. — buyers are in control from the open. Watch for acceptance above the VAH (bullish continuation) or rejection back into the VA (failed breakout)
- Open below prior VALDefinitionValue Area Low — the lower boundary of the zone where 70% of volume traded. Acts as support. — sellers are in control from the open. Watch for acceptance below the VAL (bearish continuation) or rejection back into the VA (failed breakdown)
- Open at or near prior POCDefinitionPoint of Control — the price with the highest volume. Where the most trading happened. — the market is opening at fair value. No directional bias yet. Wait for the first initiative move
The open type tells you the starting condition. It does not tell you what will happen next — you need the footprint and structure for that. But it gives you the context to interpret everything else.
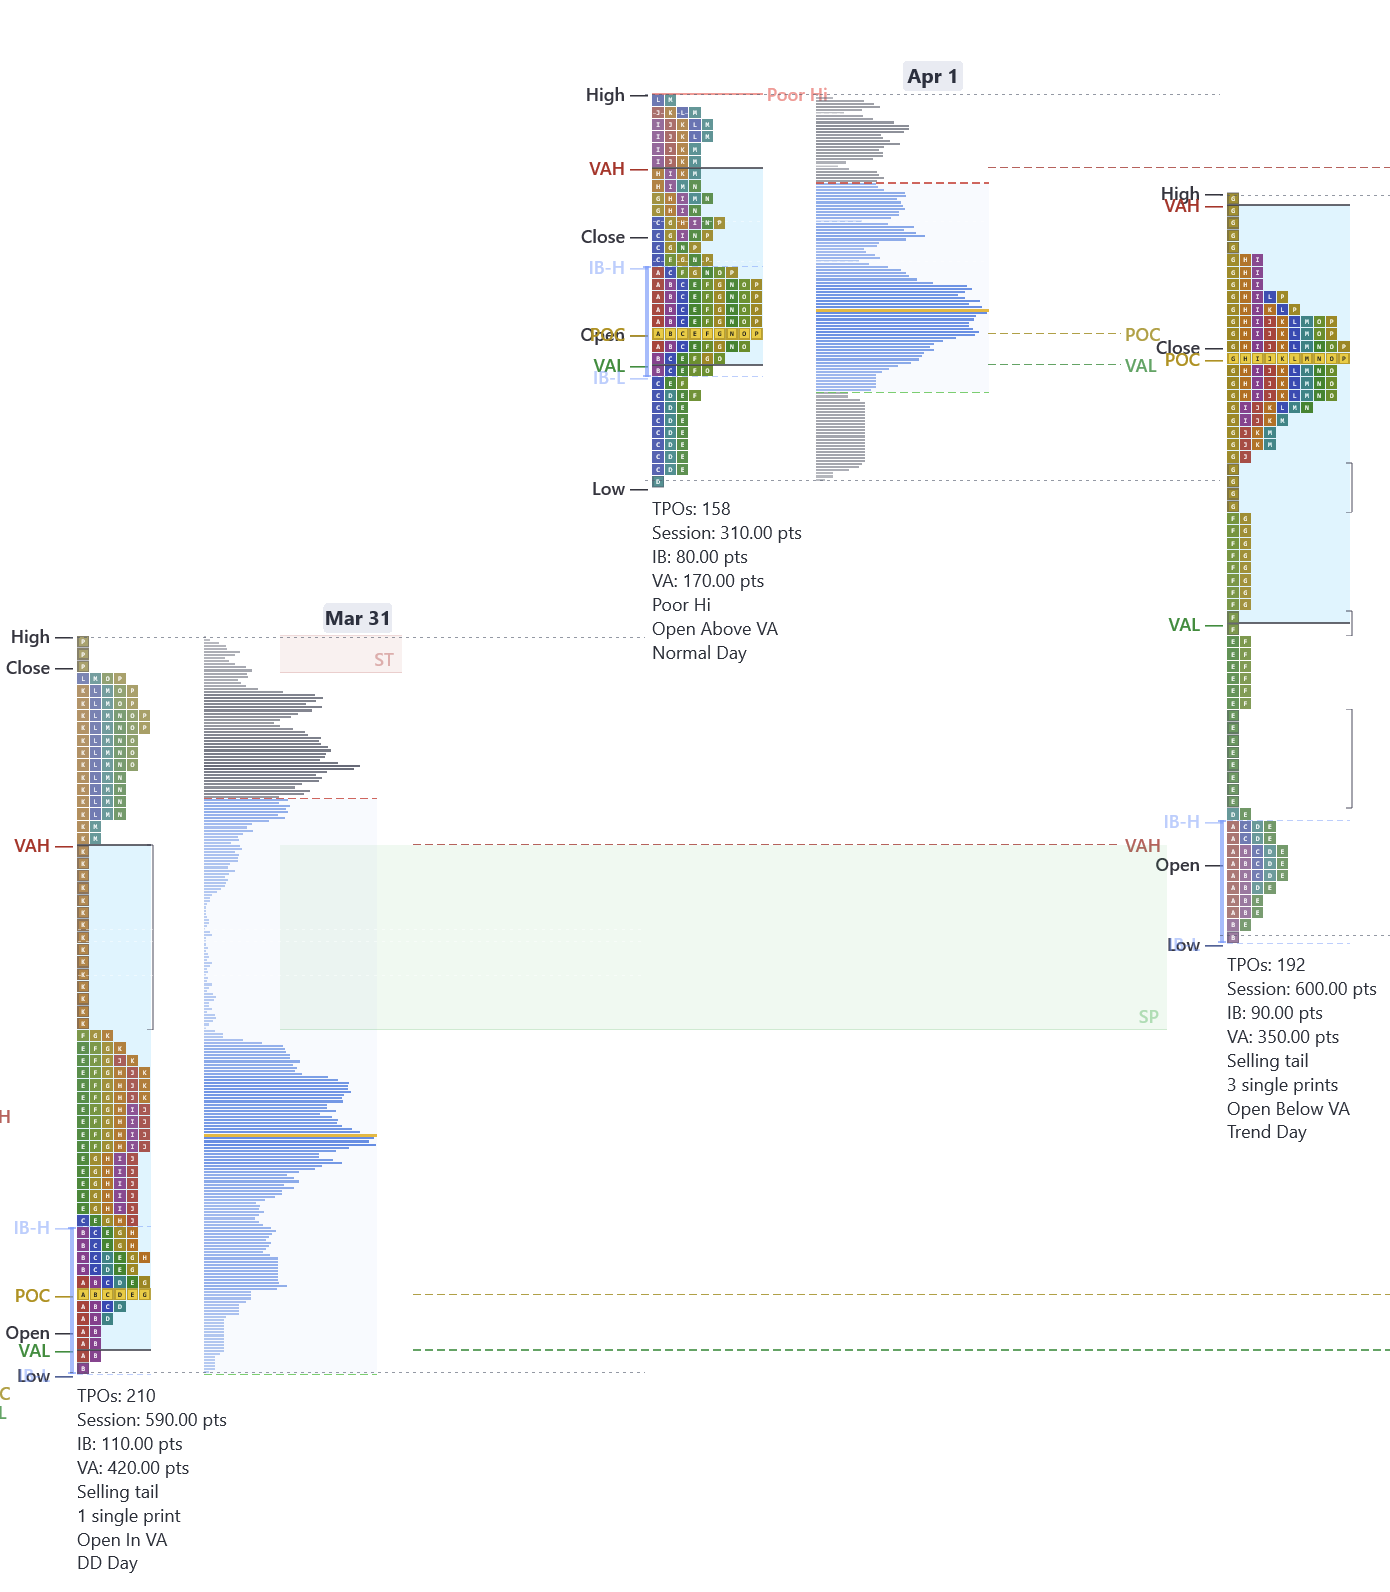
Here is a real MNQDefinitionMicro E-mini Nasdaq 100 — 1/10th the size of NQ. 1 tick = $0.50, 1 point = $2. Fast moves, beginner-sized risk. chart from March 31 showing this in action. Price opens inside the prior session's Value AreaDefinitionThe price range where 70% of volume traded. Defined by Value Area High (VAH) and Value Area Low (VAL). (the POCDefinitionPoint of Control — the price with the highest volume. Where the most trading happened., VAHDefinitionValue Area High — the upper boundary of the zone where 70% of volume traded. Acts as resistance., and VALDefinitionValue Area Low — the lower boundary of the zone where 70% of volume traded. Acts as support. are all clearly labeled). After balancing near the open, price breaks above the IB HighDefinitionInitial Balance High — the highest price reached in the first hour of RTH (9:30-10:30 AM ET). and extends to the upside — a textbook open-in-value into IB extensionDefinitionWhen price breaks above IB high or below IB low. Direction of extension is a strong intraday bias signal. 1x IB extension = trend day potential. day. Notice how the volume profile confirms heavy participation at the breakout level.
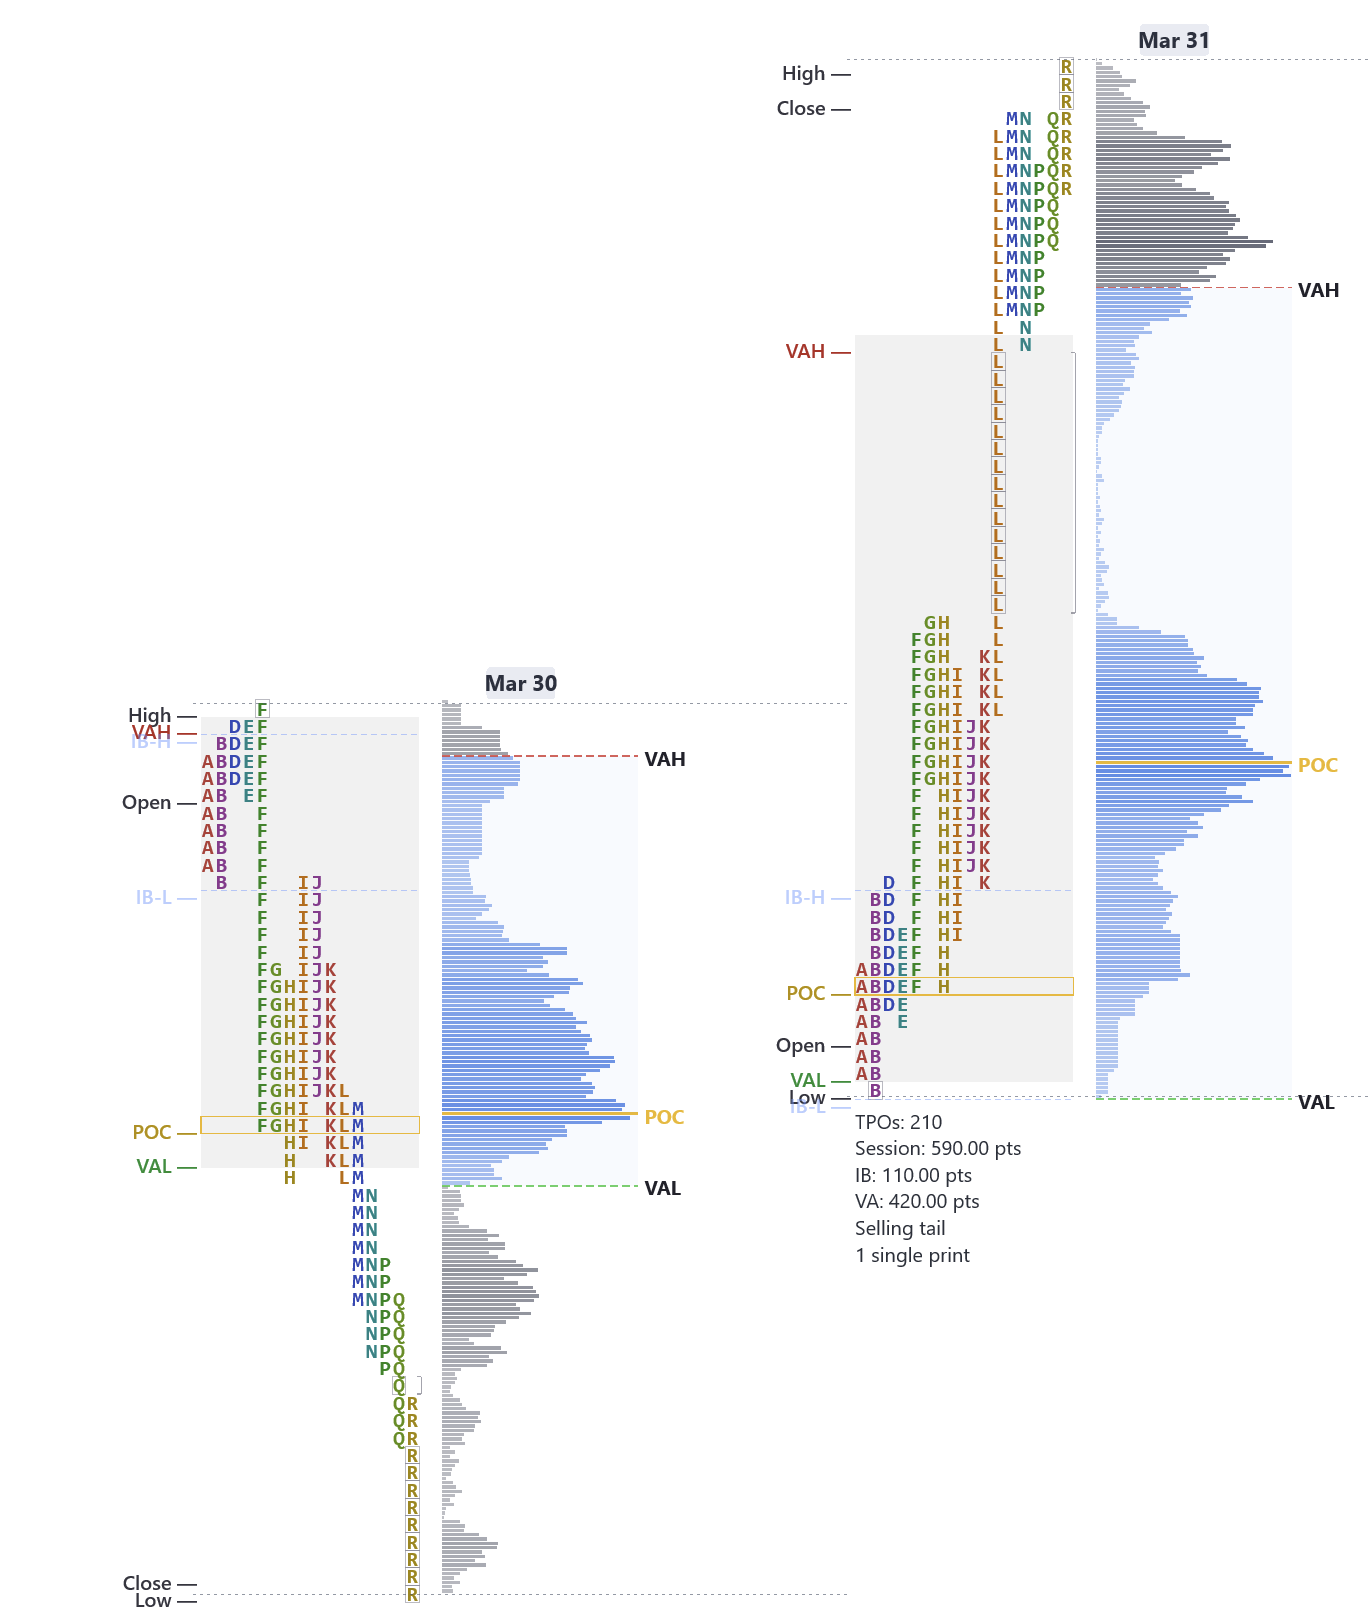
Our OrderFlow Indicator plots the full TPODefinitionTime Price Opportunity — a letter printed at each price level per 30-minute period on a Market Profile chart. profile, POCDefinitionPoint of Control — the price with the highest volume. Where the most trading happened., Value AreaDefinitionThe price range where 70% of volume traded. Defined by Value Area High (VAH) and Value Area Low (VAL)., and IB levels automatically on your NinjaTrader chart — exactly as shown above.
Here is another open-in-value example with a very different outcome. On March 20, MNQDefinitionMicro E-mini Nasdaq 100 — 1/10th the size of NQ. 1 tick = $0.50, 1 point = $2. Fast moves, beginner-sized risk. opens inside the prior session's Value AreaDefinitionThe price range where 70% of volume traded. Defined by Value Area High (VAH) and Value Area Low (VAL). and rallies into the prior day's VAHDefinitionValue Area High — the upper boundary of the zone where 70% of volume traded. Acts as resistance. — but gets rejected hard at that level. Price reverses, breaks the IB LowDefinitionInitial Balance Low — the lowest price reached in the first hour of RTH (9:30-10:30 AM ET)., and trends down all session. The prior day's VAH acted as a ceiling. When you open inside value and price tests an edge of the prior VA, the reaction at that level tells you everything about the session's direction.
The 80% Rule
The 80% RuleDefinitionIf price opens outside the Value Area but re-enters it, ~80% chance it travels to the other side. is one of the most well-known Market ProfileDefinitionA chart format using TPO letters to show how long price traded at each level. Reveals the shape of the auction. setups:
- If price opens outside the prior Value AreaDefinitionThe price range where 70% of volume traded. Defined by Value Area High (VAH) and Value Area Low (VAL). and then re-enters it (crosses back through the VAHDefinitionValue Area High — the upper boundary of the zone where 70% of volume traded. Acts as resistance. or VALDefinitionValue Area Low — the lower boundary of the zone where 70% of volume traded. Acts as support.), there is roughly an 80% probability that price will travel all the way to the other side of the Value Area
- Example — price opens above the prior VAHDefinitionValue Area High — the upper boundary of the zone where 70% of volume traded. Acts as resistance., sells off, and drops back inside the VA. The 80% RuleDefinitionIf price opens outside the Value Area but re-enters it, ~80% chance it travels to the other side. says price is likely to reach the VALDefinitionValue Area Low — the lower boundary of the zone where 70% of volume traded. Acts as support.
- The logic is based on auction market theory — if the market rejected the extreme and returned to value, it has momentum to travel through the accepted range to test the other side
The 80% RuleDefinitionIf price opens outside the Value Area but re-enters it, ~80% chance it travels to the other side. is a probability, not a guarantee. Combine it with footprint confirmation — look for imbalancesDefinitionA price level where one side overwhelms the other by 3:1 or more. Shows where big players committed. and deltaDefinitionAsk volume minus bid volume. Positive = more buying. Negative = more selling. Shows who is more aggressive. supporting the move through the Value AreaDefinitionThe price range where 70% of volume traded. Defined by Value Area High (VAH) and Value Area Low (VAL). before committing.

Here is a real MNQDefinitionMicro E-mini Nasdaq 100 — 1/10th the size of NQ. 1 tick = $0.50, 1 point = $2. Fast moves, beginner-sized risk. example of the 80% RuleDefinitionIf price opens outside the Value Area but re-enters it, ~80% chance it travels to the other side. in action. The April 10 RTHDefinitionRegular Trading Hours — 9:30 AM to 4:00 PM ET. Where 80-90% of daily futures volume happens. The main session traders focus on. session opens outside value — above the prior session's VAHDefinitionValue Area High — the upper boundary of the zone where 70% of volume traded. Acts as resistance.. Price fails to hold above the VAH and re-enters the value area. From there it gaps down and takes out the prior day's (April 9) Value Area LowDefinitionThe bottom of the Value Area — the lowest price in the zone where 70% of volume traded., continuing lower. The 80% Rule played out textbook — once price re-entered value, it traveled all the way through to the other side and beyond.
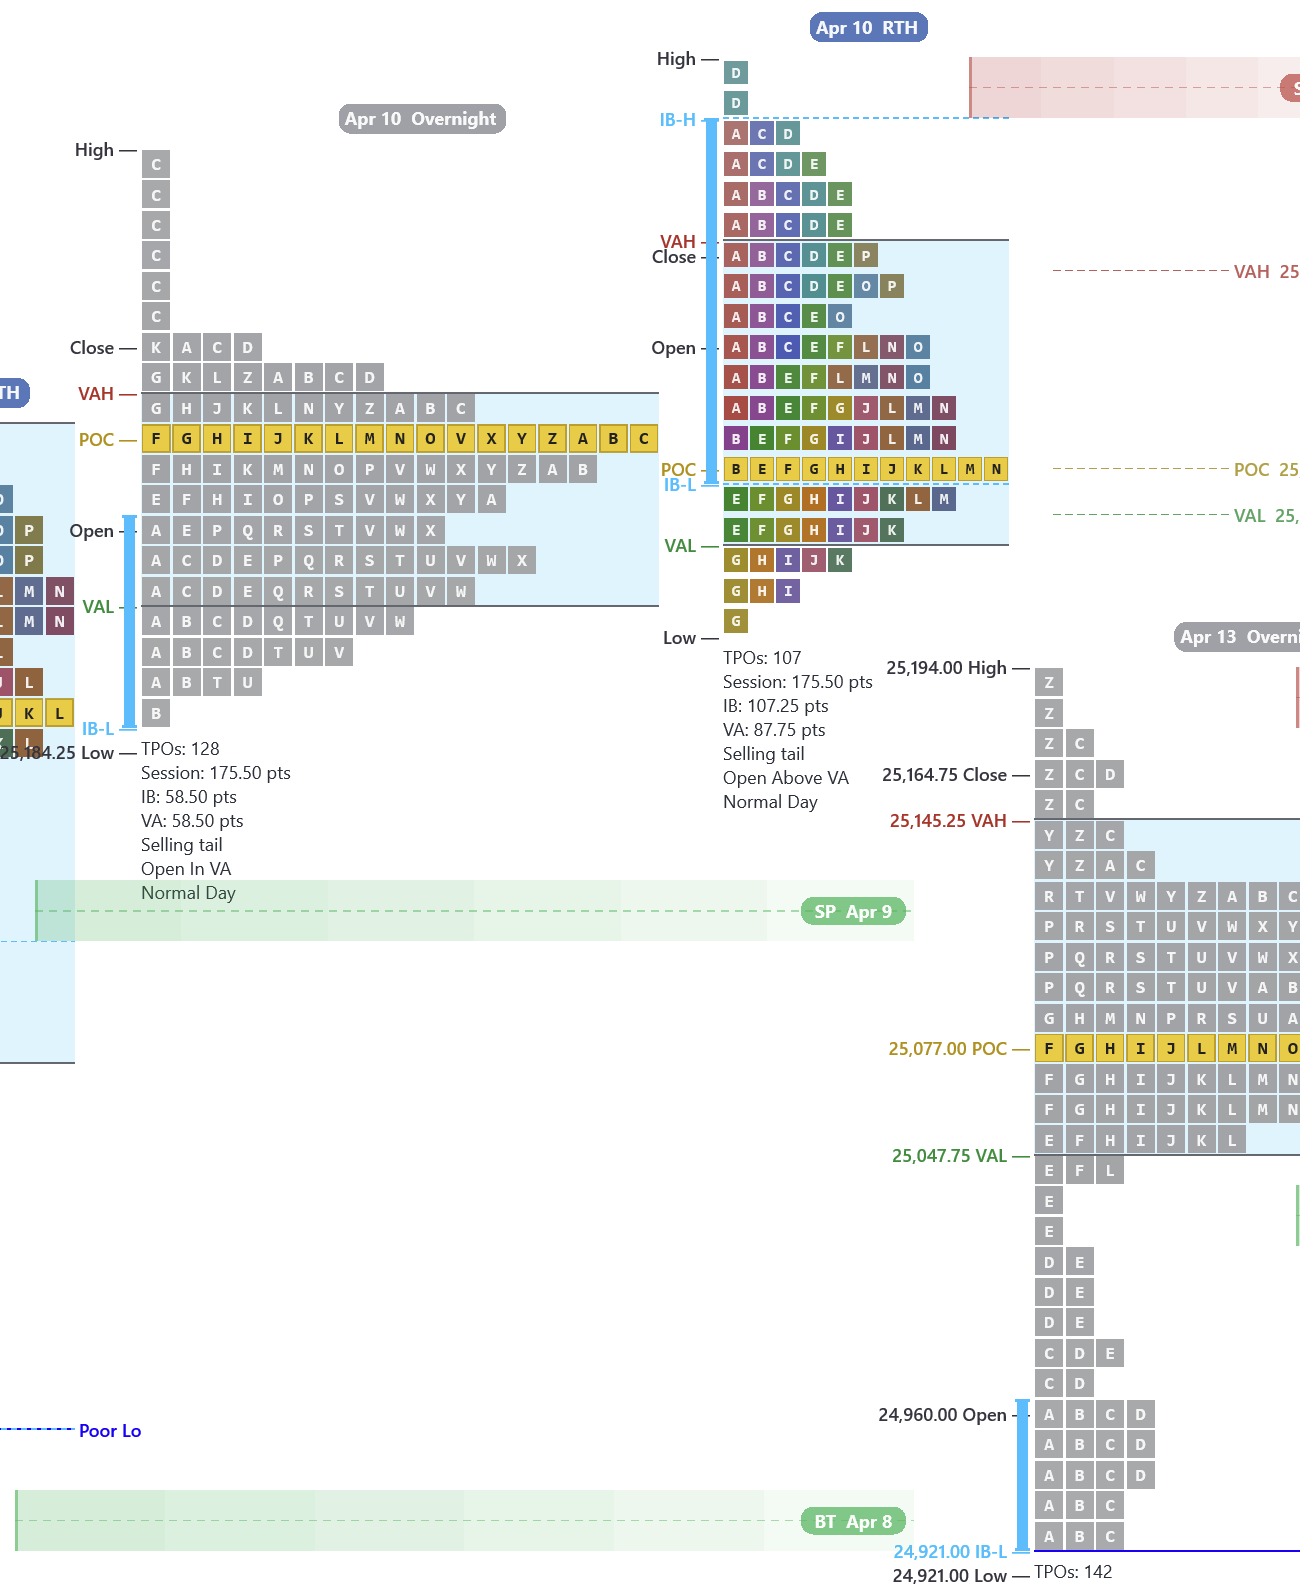
When price opens outside value and re-enters, the 80% RuleDefinitionIf price opens outside the Value Area but re-enters it, ~80% chance it travels to the other side. says it will travel to the other side. When multiple profile signals align — the failed breakout, the re-entry, and a poor lowDefinitionProfile low with multiple TPOs but no single-print tail. Auction incomplete — price tends to revisit. below — the trade has the highest conviction.
IB Extension Trades
When price breaks the Initial BalanceDefinitionThe price range of the first hour (A + B periods). Narrow IB = trend day. Wide IB = range day., you have a potential trend trade:
- Wait for the IB HighDefinitionInitial Balance High — the highest price reached in the first hour of RTH (9:30-10:30 AM ET). or IB LowDefinitionInitial Balance Low — the lowest price reached in the first hour of RTH (9:30-10:30 AM ET). to break
- Confirm with one-time framing — each new period prints a higher high (for longs) or a lower low (for shorts)
- Use IB extensionDefinitionWhen price breaks above IB high or below IB low. Direction of extension is a strong intraday bias signal. 1x IB extension = trend day potential. measured-move targets: 1x IB range is the first target, 1.5x is the strong extension target, and 2x is the full trend-day target
- If the IB was narrow, expect a larger extension — narrow IBs produce the best trend days. A narrow IB that breaks one side often reaches 1.5x to 2x
- Confirm with deltaDefinitionAsk volume minus bid volume. Positive = more buying. Negative = more selling. Shows who is more aggressive. — rising cumulative deltaDefinitionRunning total of buying vs selling across the session. Shows who has been in control overall. on a long extension, falling on a short extension
- Failed extension — if price breaks the IB but immediately reverses back inside within the same period, it is a trap. Look for a rotation to the opposite side of the IB

Here is a real NQDefinitionE-mini Nasdaq 100 futures contract. Known for fast, volatile moves. 1 tick = $5, 1 point = $20. 5-minute chart showing this concept in action. Notice how the IB LowDefinitionInitial Balance Low — the lowest price reached in the first hour of RTH (9:30-10:30 AM ET). (marked by the blue horizontal zone) acts as support after the initial balance is established. Price bounces cleanly off the IB Low level, and the volume profile on the left confirms heavy volume was traded at that zone — creating a strong floor. The volume profile POCDefinitionPoint of Control — the price with the highest volume. Where the most trading happened. sits right at the IB Low, reinforcing it as a key level.
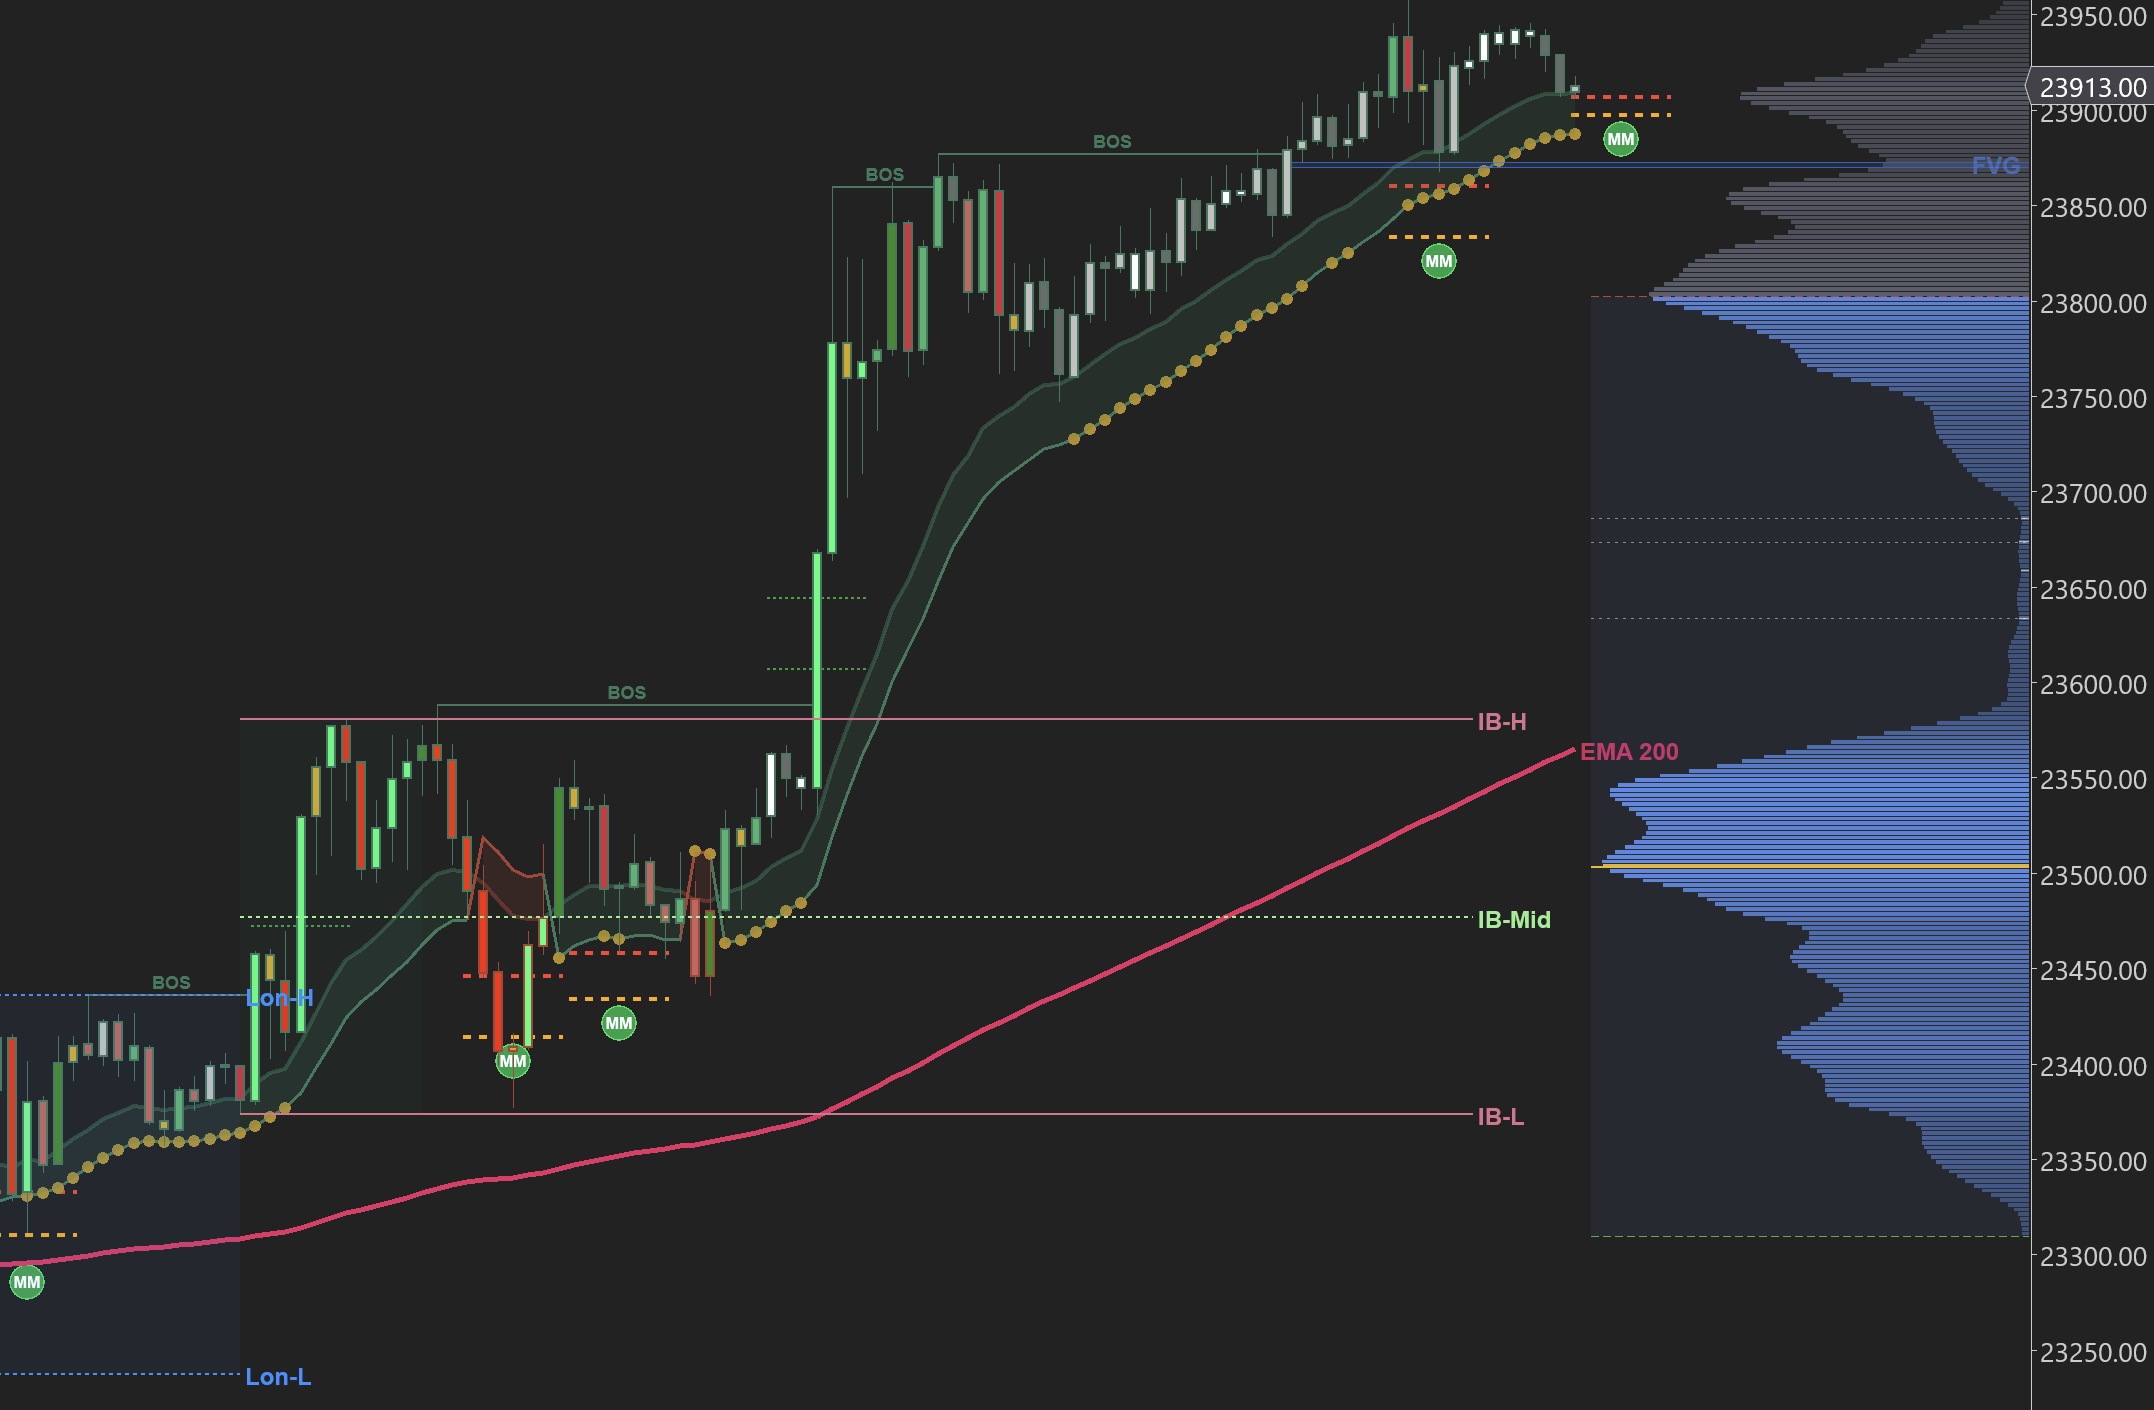
Our Market Structure Indicator automatically plots IB HighDefinitionInitial Balance High — the highest price reached in the first hour of RTH (9:30-10:30 AM ET). and IB LowDefinitionInitial Balance Low — the lowest price reached in the first hour of RTH (9:30-10:30 AM ET). levels on your NinjaTrader chart, while the OrderFlow Indicator gives you the volume profile and footprint data to confirm entries at these levels. Together, they show you exactly where the key levels are and what is happening when price gets there.
Poor High and Poor Low Retests
Poor highsDefinitionProfile high with multiple TPOs but no single-print tail. Auction incomplete — price tends to revisit. and poor lowsDefinitionProfile low with multiple TPOs but no single-print tail. Auction incomplete — price tends to revisit. from prior sessions are unfinished auctions waiting to be completed:
- When price approaches a prior poor highDefinitionProfile high with multiple TPOs but no single-print tail. Auction incomplete — price tends to revisit., expect a test above it — the market needs to find sellers
- When price approaches a prior poor lowDefinitionProfile low with multiple TPOs but no single-print tail. Auction incomplete — price tends to revisit., expect a test below it — the market needs to find buyers
- These retests often produce clean entries — the prior poor extreme gets swept, the auction completes, and price reverses
- Use the footprint at the retest to confirm — absorptionDefinitionHeavy aggressive orders hit a level but price doesn't move — a large passive player is absorbing the flow. at the poor highDefinitionProfile high with multiple TPOs but no single-print tail. Auction incomplete — price tends to revisit. (sellers absorbing buyers) is your signal to short

Single Print Support and Resistance
Single printsDefinitionPrice levels with only one TPO letter — price moved through quickly. Often act as support or resistance on retest. from prior sessions act as support and resistance:
- Single printsDefinitionPrice levels with only one TPO letter — price moved through quickly. Often act as support or resistance on retest. are prices the market moved through quickly — there was initiative activity but no acceptance
- When price returns to a single printDefinitionPrice levels with only one TPO letter — price moved through quickly. Often act as support or resistance on retest. zone, watch for a reaction
- If the market fills the single printsDefinitionPrice levels with only one TPO letter — price moved through quickly. Often act as support or resistance on retest. (spends time there), the prior initiative move is being unwound
- If the market bounces off the single printDefinitionPrice levels with only one TPO letter — price moved through quickly. Often act as support or resistance on retest. zone, the prior initiative activity is being confirmed

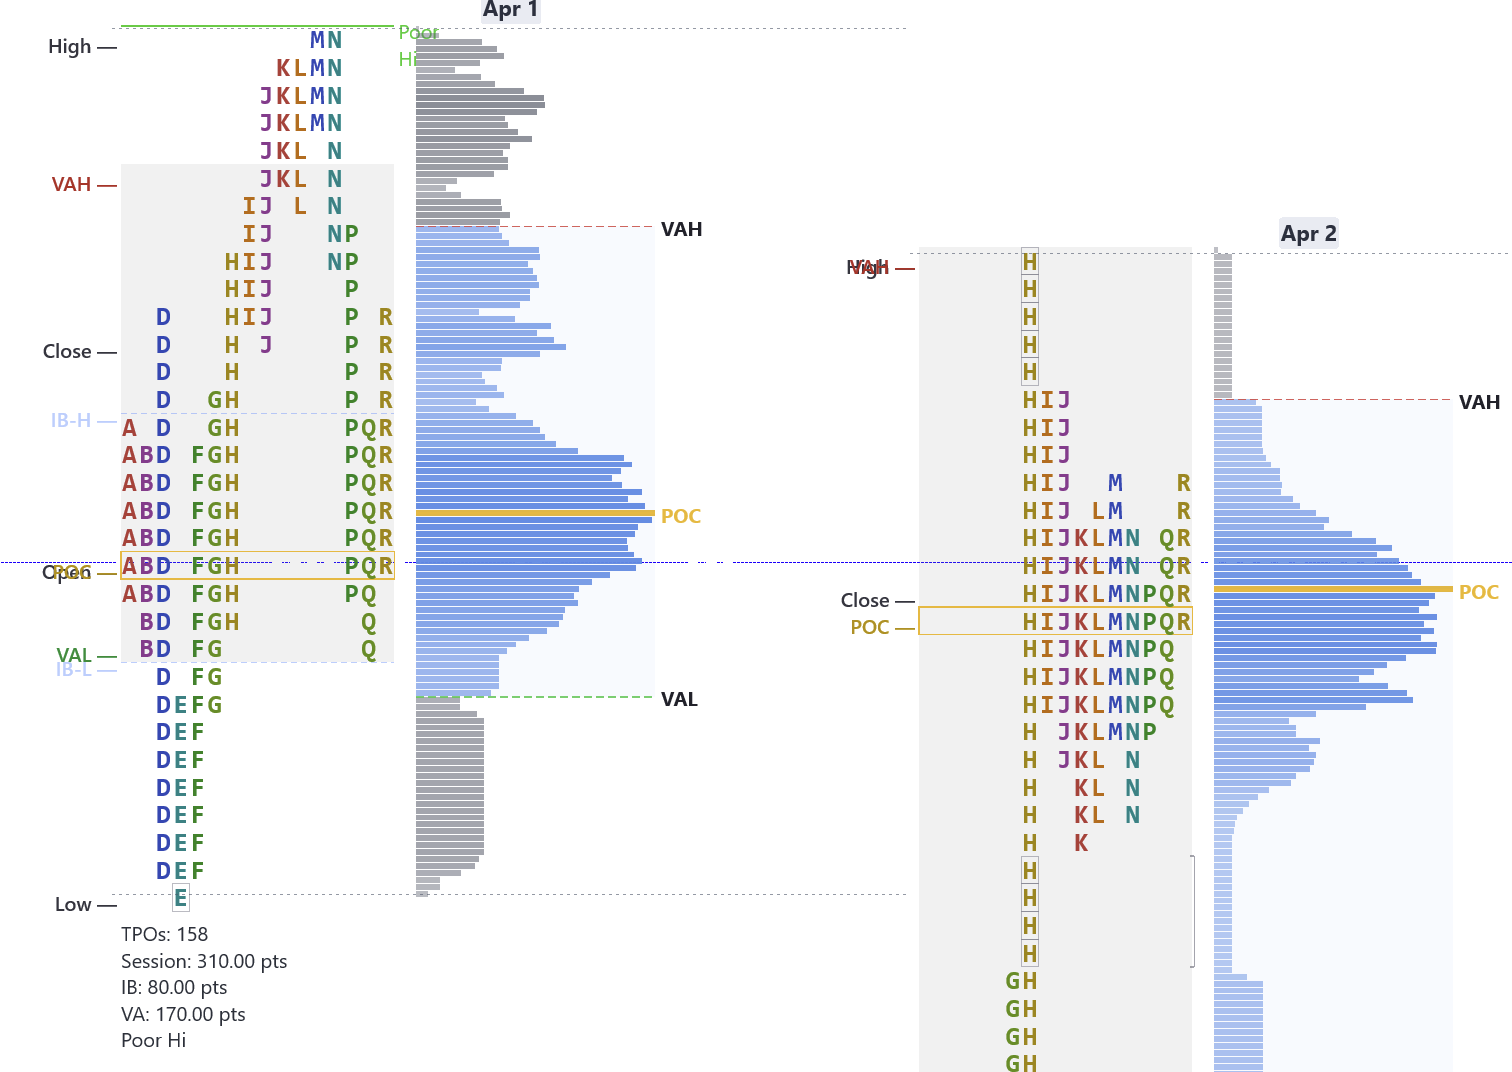
Here is a real example. March 31 MNQDefinitionMicro E-mini Nasdaq 100 — 1/10th the size of NQ. 1 tick = $0.50, 1 point = $2. Fast moves, beginner-sized risk. is a double distributionDefinitionTwo clusters of value separated by single prints. The market repriced mid-session. day (DD Day) with a single printDefinitionPrice levels with only one TPO letter — price moved through quickly. Often act as support or resistance on retest. zone (green shaded area marked SP) between the two value clusters. The next session opens below the prior VA and trends down — when price reaches the single print zone, it moves through quickly because that zone was never accepted as value. The indicator highlights single print zones automatically so you can see exactly where these initiative levels are.
Spike Rules
A spike occurs when price makes a dramatic move in the final one or two periods of the session — a late-day rally or selloff that creates single printsDefinitionPrice levels with only one TPO letter — price moved through quickly. Often act as support or resistance on retest. at the extreme. The spike is significant because it happened late, meaning traders had to make a decision overnight about whether those prices are accepted or rejected.

The spike high and the spike base are the two key reference levels for the next session:
- Open above spike high — acceptance of spike prices. Buyers committed overnight. The spike base becomes support. Expect continuation higher. Buy pullbacks to the spike high
- Open within the spike range — undecided. Watch which side price breaks (spike high or spike base) to determine direction. Let the market reveal its hand first
- Open below spike base — rejection of spike prices. The late-day move was emotional, not substantive. Buyers who entered during the spike are trapped. Expect selling as they liquidate. Sell rallies back to the spike base
Spikes are the market's overnight homework assignment. Where price opens the next day relative to the spike tells you whether the market accepted or rejected the late-session move — and that single data point gives you a high-probability directional bias.
Responsive vs Initiative Activity
Understanding whether activity at a given price is responsive or initiative is fundamental to reading auction markets. It determines whether to fade a move or follow it.

- Responsive buying — buying below the Value AreaDefinitionThe price range where 70% of volume traded. Defined by Value Area High (VAH) and Value Area Low (VAL).. This is expected. Prices are cheap relative to accepted value. Responsive buying maintains the current range and tends to push price back toward the POCDefinitionPoint of Control — the price with the highest volume. Where the most trading happened.
- Responsive selling — selling above the Value AreaDefinitionThe price range where 70% of volume traded. Defined by Value Area High (VAH) and Value Area Low (VAL).. This is expected. Prices are expensive. Responsive selling caps rallies and pushes price back toward the POCDefinitionPoint of Control — the price with the highest volume. Where the most trading happened.
- Initiative buying — buying at or above the Value AreaDefinitionThe price range where 70% of volume traded. Defined by Value Area High (VAH) and Value Area Low (VAL).. This is unexpected. Buyers are aggressively seeking higher prices and pushing for new value. Initiative buying breaks balance and creates new higher value areas
- Initiative selling — selling at or below the Value AreaDefinitionThe price range where 70% of volume traded. Defined by Value Area High (VAH) and Value Area Low (VAL).. This is unexpected. Sellers are aggressively forcing lower prices. Initiative selling breaks balance and creates new lower value areas
The key question at any level is: is this activity expected or unexpected at this price?
- Expected activity (responsive) → fade it. Trade back toward the POCDefinitionPoint of Control — the price with the highest volume. Where the most trading happened.
- Unexpected activity (initiative) → follow it. New value is being created
When you see responsive buying at the VALDefinitionValue Area Low — the lower boundary of the zone where 70% of volume traded. Acts as support., expect a rotation back toward the POCDefinitionPoint of Control — the price with the highest volume. Where the most trading happened. — that is the market doing what it should. When you see initiative buying at the VAHDefinitionValue Area High — the upper boundary of the zone where 70% of volume traded. Acts as resistance. (breaking through it with conviction), that is the market doing something unexpected — new buyers are driving for higher value. Follow the initiative, fade the responsive.
Balance Area Breakout and Failed Auction
When value areas overlap across multiple sessions, a balance area (bracket) forms. Price rotates within this range, and the composite POCDefinitionPOC of a multi-session composite profile. Carries more weight than any single-session POC. acts as a magnet. The real trading opportunities come when price attempts to leave the bracket.

The Breakout
When time and volume build at the edge of a balance area — not just a single probe, but actual acceptance — a genuine breakout is developing:
- Trade in the breakout direction once price establishes value outside the bracket (multiple TPODefinitionTime Price Opportunity — a letter printed at each price level per 30-minute period on a Market Profile chart. periods printing outside)
- Target a measured moveDefinitionA price projection where Leg B equals Leg A. Halsey's primary target is the -23.6% extension beyond 100%. equal to the height of the bracket, projected from the breakout point
- The bracket edge (the line that was resistance) becomes support on pullbacks
- Confirm with initiative activity — you want to see initiative buying above the bracket, not just responsive selling drying up
The Failed Auction
If price breaks beyond the balance area but fails to establish value in the new zone and re-enters the bracket, expect a full rotation to the opposite end of the balance. This is one of the highest-probability setups in Market ProfileDefinitionA chart format using TPO letters to show how long price traded at each level. Reveals the shape of the auction.:
- The failure means the breakout attracted no new participants — it was a false move
- Traders who entered on the breakout are now trapped and will liquidate, fueling the reversal
- Target the opposite side of the bracket (or the composite POCDefinitionPOC of a multi-session composite profile. Carries more weight than any single-session POC. as a minimum)
- Confirmation: price re-enters the bracket for two or more consecutive 30-minute periods (same acceptance logic as the 80% Rule)
The failed auction at a bracket edge is the Market ProfileDefinitionA chart format using TPO letters to show how long price traded at each level. Reveals the shape of the auction. version of a "failed breakout." The setup is simple — if the market tries to leave balance and fails, it will rotate to the other side. Combine this with poor highsDefinitionProfile high with multiple TPOs but no single-print tail. Auction incomplete — price tends to revisit. or poor lowsDefinitionProfile low with multiple TPOs but no single-print tail. Auction incomplete — price tends to revisit. at the bracket edge and you have the highest-conviction Market Profile trade there is.
Combining Market Profile With Footprint
Market ProfileDefinitionA chart format using TPO letters to show how long price traded at each level. Reveals the shape of the auction. tells you where to look. The footprint tells you what is happening when price gets there:
- Profile gives you the levels — prior POCDefinitionPoint of Control — the price with the highest volume. Where the most trading happened., VAHDefinitionValue Area High — the upper boundary of the zone where 70% of volume traded. Acts as resistance., VALDefinitionValue Area Low — the lower boundary of the zone where 70% of volume traded. Acts as support., single printsDefinitionPrice levels with only one TPO letter — price moved through quickly. Often act as support or resistance on retest., poor highsDefinitionProfile high with multiple TPOs but no single-print tail. Auction incomplete — price tends to revisit. and lows
- Footprint gives you the confirmation — imbalancesDefinitionA price level where one side overwhelms the other by 3:1 or more. Shows where big players committed., absorptionDefinitionHeavy aggressive orders hit a level but price doesn't move — a large passive player is absorbing the flow., deltaDefinitionAsk volume minus bid volume. Positive = more buying. Negative = more selling. Shows who is more aggressive. at those levels
- Example: price pulls back to the prior session POCDefinitionPoint of Control — the price with the highest volume. Where the most trading happened.. The profile says this is fair value. The footprint shows stacked buying imbalancesDefinitionA price level where one side overwhelms the other by 3:1 or more. Shows where big players committed. and positive deltaDefinitionAsk volume minus bid volume. Positive = more buying. Negative = more selling. Shows who is more aggressive.. That is a high-conviction long entry
- Without the footprint, you are trading levels blindly. Without the profile, you do not know which levels matter
Market ProfileDefinitionA chart format using TPO letters to show how long price traded at each level. Reveals the shape of the auction. provides the map. The footprint provides the real-time intelligence. Use the profile to identify where you want to trade. Use the footprint to confirm whether you should actually take the trade.