Why Profile Shapes Matter
The shape of a completed session profile tells you a story about what happened that day. Was it balanced? Did one side dominate? Did the market reprice to a new level? You can read all of this at a glance from the shape.

The profile shape is the market's fingerprint for that session. Learn to read the shape and you can instantly classify what happened — balance, rally, sell-off, or repricing.
D-Shape (Normal / Balanced)

- The classic bell curve — fat in the middle, thin at the extremes
- Most of the time (and volume) was spent near the center of the range
- The POCDefinitionPoint of Control — the price with the highest volume. Where the most trading happened. is near the middle of the profile
- This is what a balanced, two-sided market looks like — neither buyers nor sellers dominated
- Trade strategy: fade the extremes, target the POCDefinitionPoint of Control — the price with the highest volume. Where the most trading happened.
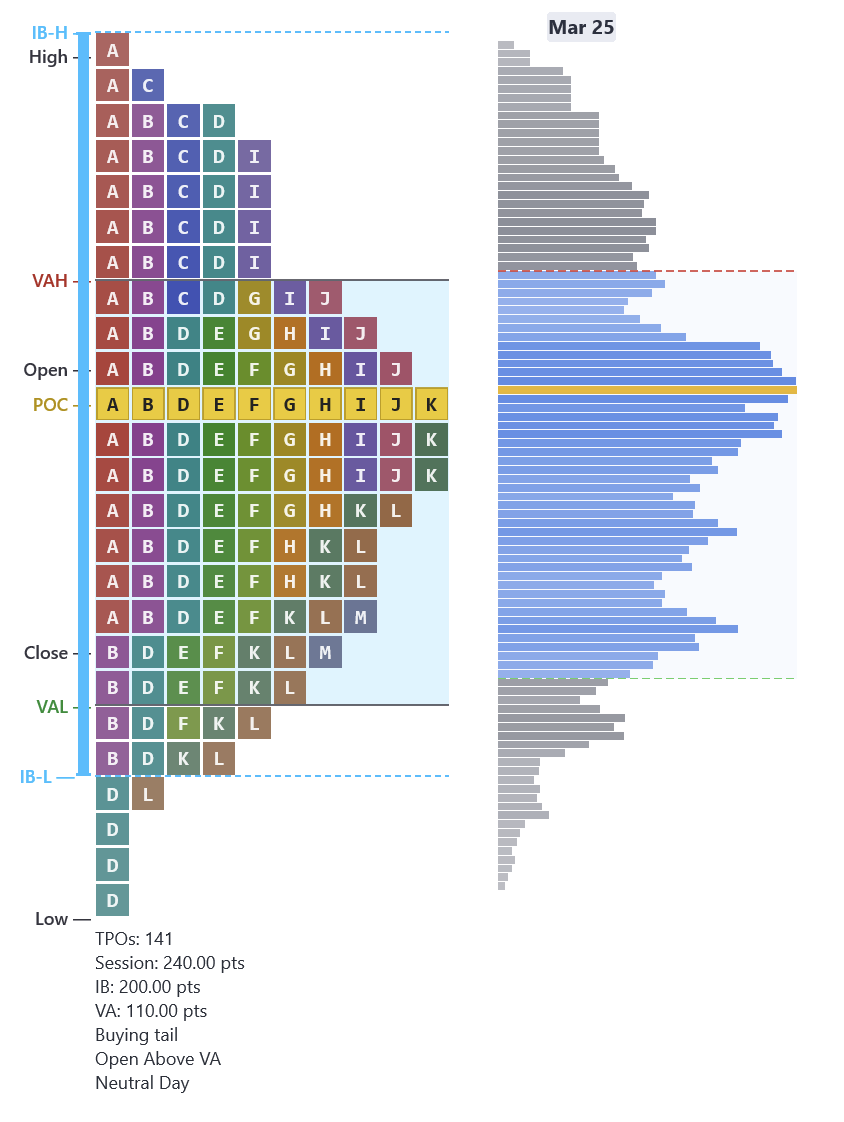
Here is a real MNQDefinitionMicro E-mini Nasdaq 100 — 1/10th the size of NQ. 1 tick = $0.50, 1 point = $2. Fast moves, beginner-sized risk. D-shapeDefinitionBalanced Market Profile — symmetric bell curve. Two-sided trade, fair value accepted in the middle. from March 25. The profile is widest in the middle where the POCDefinitionPoint of Control — the price with the highest volume. Where the most trading happened. sits, with thin tails at both the high and low. The session range was 260 points with a 150-point IB and 110-point value area — a balanced, two-sided session where neither buyers nor sellers took control.
P-Shape (Rally / Short Covering)

- Fat at the top, thin tail at the bottom
- Price rallied during the session and most activity concentrated at the highs
- The POCDefinitionPoint of Control — the price with the highest volume. Where the most trading happened. is in the upper portion of the profile
- Can be caused by genuine buying or by short covering (shorts being forced to buy back)
- Use delta to confirm — rising cumulative deltaDefinitionRunning total of buying vs selling across the session. Shows who has been in control overall. with the P-shapeDefinitionMarket Profile with fat top, thin bottom. Indicates a rally or short-covering session. means real buying. Flat or negative delta means short covering, and the rally may not hold
A P-shapeDefinitionMarket Profile with fat top, thin bottom. Indicates a rally or short-covering session. profile looks bullish, but not all P-shapes are created equal. Check deltaDefinitionAsk volume minus bid volume. Positive = more buying. Negative = more selling. Shows who is more aggressive.. If the rally was driven by short covering rather than new buying, the move is likely to fade.
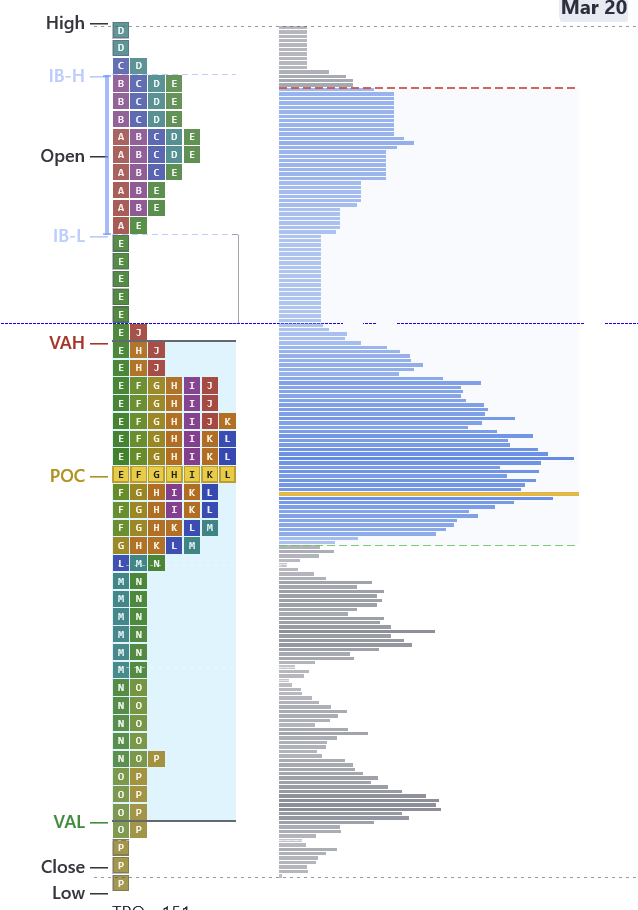
Here is a real MNQDefinitionMicro E-mini Nasdaq 100 — 1/10th the size of NQ. 1 tick = $0.50, 1 point = $2. Fast moves, beginner-sized risk. P-shapeDefinitionMarket Profile with fat top, thin bottom. Indicates a rally or short-covering session. from March 2. Price opens near the low and rallies through the session. The POCDefinitionPoint of Control — the price with the highest volume. Where the most trading happened. and value area sit in the upper portion of the profile, with a thin tail of early letters stretching down to the open. The 510-point session range with a 130-point IB shows the extension was significant — price moved well beyond the first hour's range.
b-Shape (Sell-Off / Liquidation)

- Fat at the bottom, thin tail at the top
- Price sold off during the session and most activity concentrated at the lows
- The POCDefinitionPoint of Control — the price with the highest volume. Where the most trading happened. is in the lower portion of the profile
- Can be caused by genuine selling or by long liquidation (longs being forced to sell)
- Use delta to confirm — falling cumulative deltaDefinitionRunning total of buying vs selling across the session. Shows who has been in control overall. with the b-shapeDefinitionMarket Profile with fat bottom, thin top. Indicates a sell-off or long-liquidation session. means real selling. Flat or positive delta means liquidation, and the sell-off may reverse
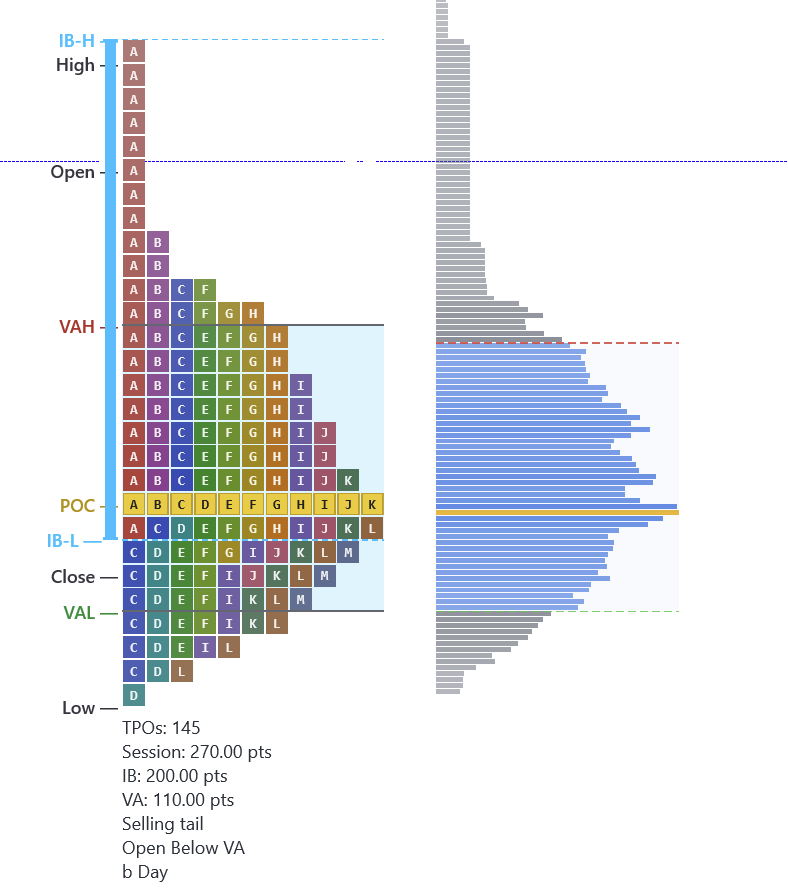
Here is a real MNQDefinitionMicro E-mini Nasdaq 100 — 1/10th the size of NQ. 1 tick = $0.50, 1 point = $2. Fast moves, beginner-sized risk. b-shapeDefinitionMarket Profile with fat bottom, thin top. Indicates a sell-off or long-liquidation session. from March 12. Price opens at the high during the A period and sells off all session. The single-print A-period tail at the top shows initiative selling — the market moved through those prices quickly and never came back. The POCDefinitionPoint of Control — the price with the highest volume. Where the most trading happened. and value area sit in the lower portion of the profile where the market spent the most time and traded the most volume.
Double Distribution

- Two clusters of activity separated by a thin zone of single printsDefinitionPrice levels with only one TPO letter — price moved through quickly. Often act as support or resistance on retest.
- The market established value at one level, then broke away and established a new value area
- This is a repricing event — the market decided the old value was wrong and moved to find new value
- The single printsDefinitionPrice levels with only one TPO letter — price moved through quickly. Often act as support or resistance on retest. between the two distributions act as strong support or resistance
- Double distributionDefinitionTwo clusters of value separated by single prints. The market repriced mid-session. days often follow news events, economic data, or a catalyst that changed the market's view
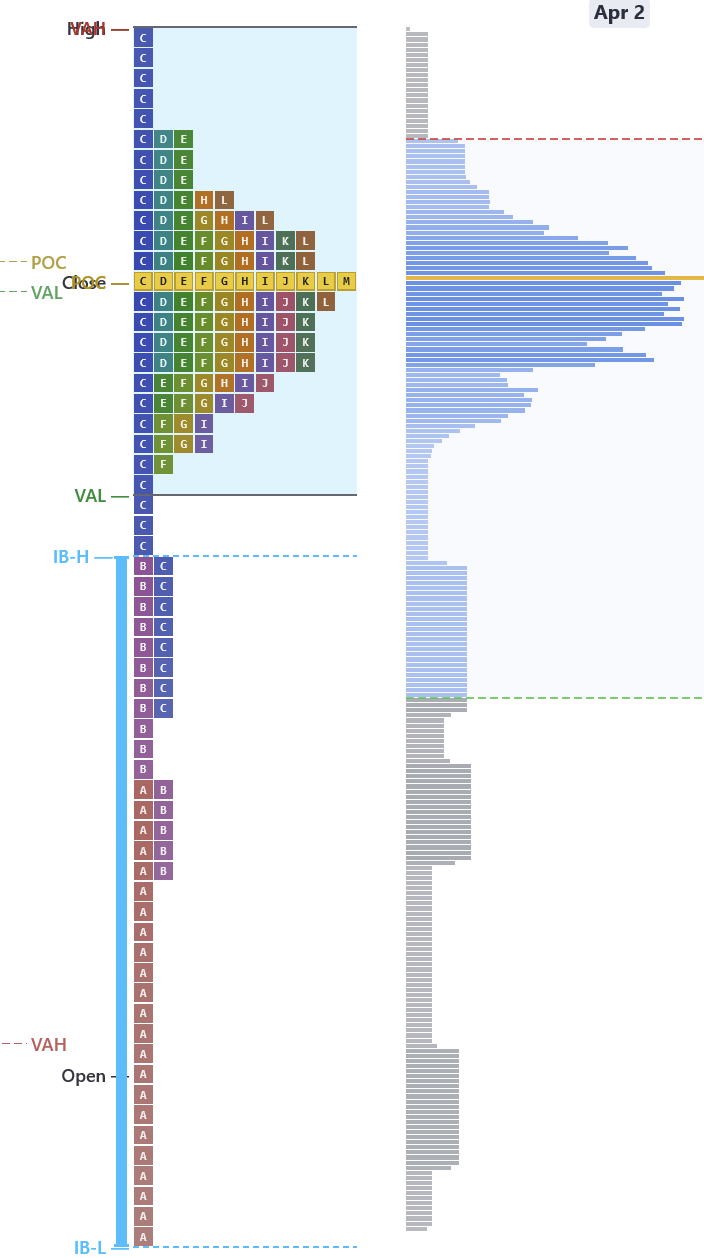
Here is a real MNQDefinitionMicro E-mini Nasdaq 100 — 1/10th the size of NQ. 1 tick = $0.50, 1 point = $2. Fast moves, beginner-sized risk. double distributionDefinitionTwo clusters of value separated by single prints. The market repriced mid-session. from March 31. You can see two distinct clusters of activity — the lower cluster near the open where the market initially balanced, and the upper cluster where the POCDefinitionPoint of Control — the price with the highest volume. Where the most trading happened. ended up after the market repriced higher. The thin zone of single printsDefinitionPrice levels with only one TPO letter — price moved through quickly. Often act as support or resistance on retest. between the two distributions marks where the market moved through quickly, and that zone now acts as support.
Elongated / Trend Day
- Long and thin — very little horizontal development at any single price
- Price moved in one direction all session with almost no rotation
- Extremely narrow profile with no clear POCDefinitionPoint of Control — the price with the highest volume. Where the most trading happened. cluster
- These are the highest-conviction days — one side had complete control from open to close
- Trend days are rare (roughly 10-15% of sessions) but produce the largest moves
Trend days are where the biggest money is made. The key is recognizing them early — narrow IB, immediate extension, one-time framing. Once you identify a trend dayDefinitionA session where price moves persistently in one direction. Typically signaled by narrow IB + strong extension. Trade with the trend. in progress, do not fight it.