What Is the Initial Balance?
The Initial BalanceDefinitionThe price range of the first hour (A + B periods). Narrow IB = trend day. Wide IB = range day. (IB) is the price range established during the first hour of the regular trading session — the A and B periods in Market ProfileDefinitionA chart format using TPO letters to show how long price traded at each level. Reveals the shape of the auction. terms. It is the range where the first wave of institutional orders set the tone for the day.

The Initial BalanceDefinitionThe price range of the first hour (A + B periods). Narrow IB = trend day. Wide IB = range day. is the opening statement of the session. It tells you who showed up first, how much conviction they have, and what kind of day to expect.
IB High and IB Low
- IB HighDefinitionInitial Balance High — the highest price reached in the first hour of RTH (9:30-10:30 AM ET). — the highest price reached during the first hour. Acts as resistance for the rest of the session
- IB LowDefinitionInitial Balance Low — the lowest price reached in the first hour of RTH (9:30-10:30 AM ET). — the lowest price reached during the first hour. Acts as support for the rest of the session
- These two levels are your first reference points every single session
- Many professional traders will not take a directional trade until price breaks the IB HighDefinitionInitial Balance High — the highest price reached in the first hour of RTH (9:30-10:30 AM ET). or IB LowDefinitionInitial Balance Low — the lowest price reached in the first hour of RTH (9:30-10:30 AM ET).
IB Width and Day Type Prediction
The width of the Initial BalanceDefinitionThe price range of the first hour (A + B periods). Narrow IB = trend day. Wide IB = range day. predicts what kind of day is likely:
- Narrow IB — the first hour was tight and compressed. Low conviction from early participants. Expect a range extensionDefinitionWhen price breaks beyond the Initial Balance. If it extends 1x IB range, expect continuation. — one side will break the IB and trend. Narrow IBs produce trend days
- Wide IB — the first hour was volatile and covered a lot of ground. Early participants already committed. Expect rotation — price is more likely to stay inside or near the IB range. Wide IBs produce range days
- Compare the current IB width to the average IB width for that instrument over the past 20 sessions to determine if it is narrow or wide
A narrow Initial BalanceDefinitionThe price range of the first hour (A + B periods). Narrow IB = trend day. Wide IB = range day. is a coiled spring. The less price moves in the first hour, the bigger the move that follows. Wide IBs mean the energy was already spent.
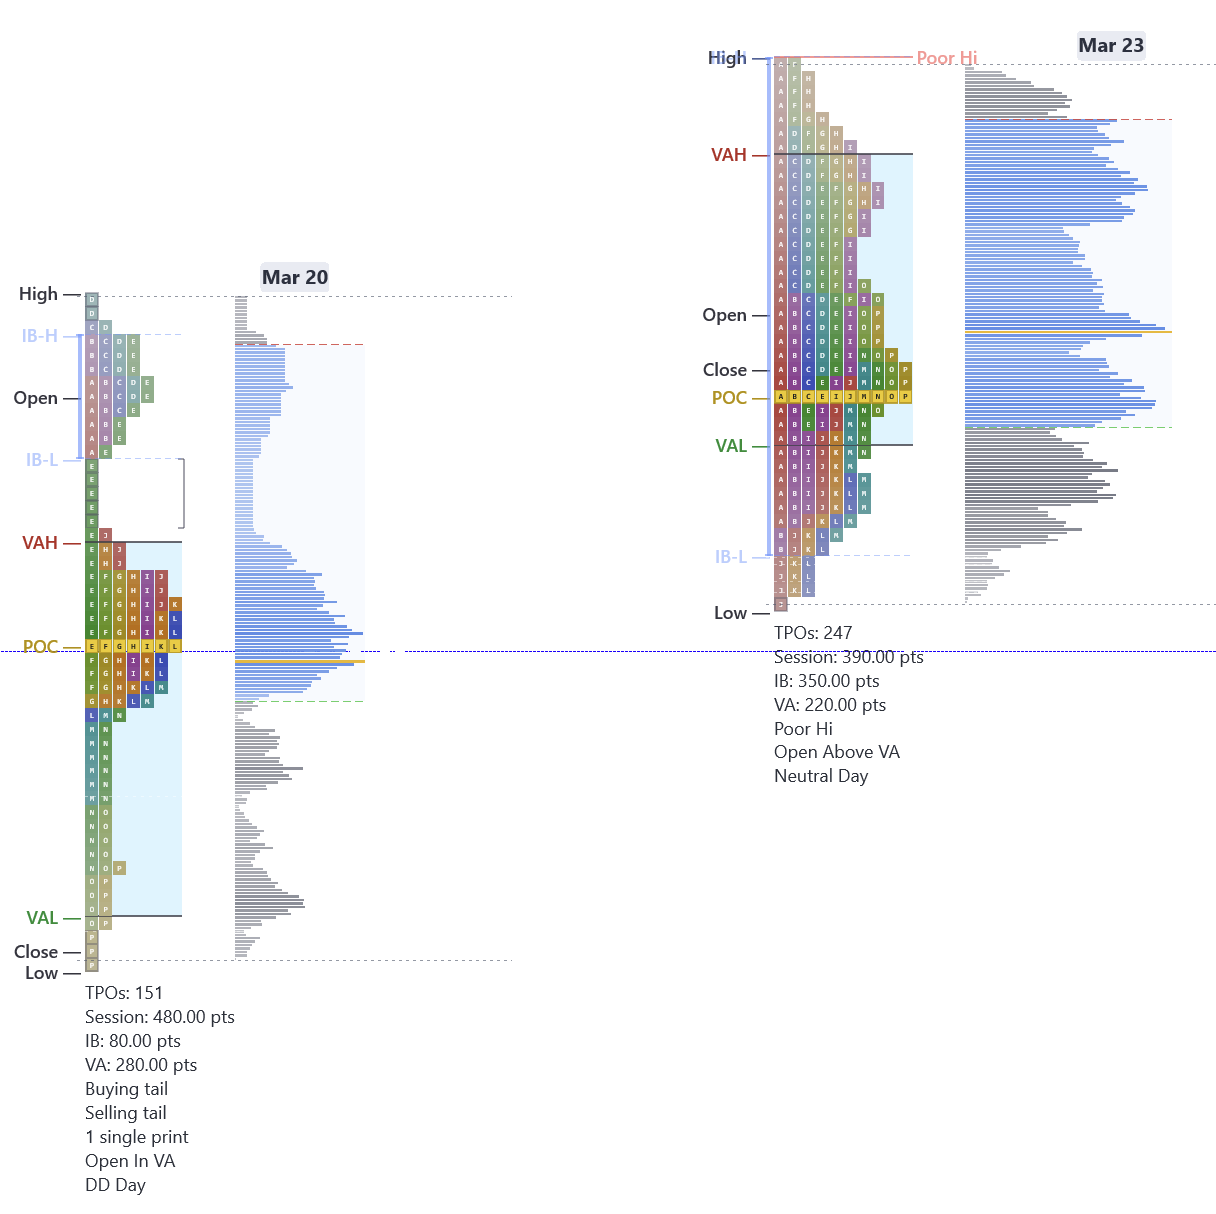
Here is a real side-by-side comparison on MNQDefinitionMicro E-mini Nasdaq 100 — 1/10th the size of NQ. 1 tick = $0.50, 1 point = $2. Fast moves, beginner-sized risk.. March 20 has a very tight IB — only 80 points. Price breaks out to the downside and trends all session, closing at its low in the P period as a DD Day. The narrow IB signaled that energy was coiled, and when it released, the move was one-directional. Compare that to March 23 — the IB is 200 points wide, covering most of the session range early. The result is a Neutral Day with 247 TPOsDefinitionTime Price Opportunity — a letter printed at each price level per 30-minute period on a Market Profile chart. where price chops inside the IB range all day. The wide IB spent the energy upfront, and neither side could generate a follow-through move.
Range Extensions
A range extensionDefinitionWhen price breaks beyond the Initial Balance. If it extends 1x IB range, expect continuation. occurs when price breaks above the IB HighDefinitionInitial Balance High — the highest price reached in the first hour of RTH (9:30-10:30 AM ET). or below the IB LowDefinitionInitial Balance Low — the lowest price reached in the first hour of RTH (9:30-10:30 AM ET).:
- One-time framing up — price extends above IB HighDefinitionInitial Balance High — the highest price reached in the first hour of RTH (9:30-10:30 AM ET). and holds. Bullish signal. Each successive period prints a higher high than the last
- One-time framing down — price extends below IB LowDefinitionInitial Balance Low — the lowest price reached in the first hour of RTH (9:30-10:30 AM ET). and holds. Bearish signal. Each successive period prints a lower low than the last
- The 1x IB rule — measure the width of the IB and add it to the breakout side. If the IB is 20 points and price breaks above IB HighDefinitionInitial Balance High — the highest price reached in the first hour of RTH (9:30-10:30 AM ET)., the first target is IB High + 20 points
- Failed extensions — price breaks the IB but immediately reverses back inside. This is a trap and often leads to a move in the opposite direction
Day Type Classification
Market ProfileDefinitionA chart format using TPO letters to show how long price traded at each level. Reveals the shape of the auction. practitioners classify days based on how price behaves relative to the IB:
- Normal day — price stays mostly within the IB, small extensions on both sides
- Normal variation — moderate extensions beyond the IB, but the majority of activity stays near the IB range
- Trend dayDefinitionA session where price moves persistently in one direction. Typically signaled by narrow IB + strong extension. Trade with the trend. — price breaks the IB in one direction and never looks back. Narrow IB, strong extension, one-time framing
- Double distributionDefinitionTwo clusters of value separated by single prints. The market repriced mid-session. — price breaks the IB, establishes a new value area, then balances there. Two clusters of activity separated by single printsDefinitionPrice levels with only one TPO letter — price moved through quickly. Often act as support or resistance on retest.
- Neutral day — price extends both above the IB HighDefinitionInitial Balance High — the highest price reached in the first hour of RTH (9:30-10:30 AM ET). and below the IB LowDefinitionInitial Balance Low — the lowest price reached in the first hour of RTH (9:30-10:30 AM ET). but closes near the middle. No clear winner
Day type classification is not about labeling the day after it is over. It is about recognizing the type as it develops so you can adjust your strategy in real-time.