Learn to Trade Futures — For Free
We have been building trading indicators for a while now, and one thing has always bothered us: the education gap. Most traders buy indicators without understanding the concepts behind them. So we built something to fix that.
Today we are launching a completely free education section on our site — three full courses covering the foundations of professional futures trading. Every lesson includes custom-built SVG diagrams, real chart examples, and an interactive glossary.
Our Order Flow course covers everything you need to read a footprintDefinitionA chart showing bid and ask volume at every price inside each candle. Reveals who is buying and selling. chart. We start with the anatomy of a footprint bar — what each number means and how to read the bidDefinitionThe highest price someone is currently willing to pay to buy. If you sell at market, this is what you get. x askDefinitionThe lowest price someone is currently willing to sell at. If you buy at market, this is what you pay. format.

From there we cover delta — the single most important number on the footprintDefinitionA chart showing bid and ask volume at every price inside each candle. Reveals who is buying and selling.. Positive deltaDefinitionAsk volume minus bid volume. Positive = more buying. Negative = more selling. Shows who is more aggressive. means buyers are aggressive. Negative delta means sellers are in control. Cumulative deltaDefinitionRunning total of buying vs selling across the session. Shows who has been in control overall. shows you who has been winning across the entire session.

We also cover imbalances and stacked imbalances (institutional zones), POC, value area, and VWAP, absorption and unfinished business. Six lessons, each with clear diagrams showing exactly what to look for.

Before you can trade order flow or ICT concepts, you need to understand market structure. Our five-lesson course covers the fundamentals that professional traders use to read the market.

We break down bullish and bearish structure, CHoCH and BOS (the signals that a trend is changing), then cover impulse and correction legs, multi-timeframe analysis, and how to combine structure with order flow for confluenceDefinitionMultiple independent signals or levels aligning at the same price area. More confluence = higher probability. entries.


This is the course traders have been asking about. We cover the full ICT framework in six lessons, starting with why retail traders provide liquidityDefinitionResting orders (stop losses, limit orders) at known levels. Institutions need liquidity to fill large positions. and how institutions consume it.

Buy-side and sell-side liquidity — where stop losses cluster and why they get swept. We show you how to identify equal highs and equal lows as liquidityDefinitionResting orders (stop losses, limit orders) at known levels. Institutions need liquidity to fill large positions. targets, and how to trade the sweep instead of getting caught by it.

Order blocks and breaker blocks — the zones where institutional orders originated. We cover how to identify them, when they get mitigated, and what happens when they fail and flip polarity.

Fair value gaps — price inefficiency zones where the market moved too fast. These gaps act as magnets pulling price back. We cover the 50% rule, inverse FVGsDefinitionFair Value Gap — a three-candle pattern leaving a price void. Price tends to return and fill these gaps., and how to use them as precision entry zones.

ICT killzones — the specific hours when institutions are most active. We map out London Open, NY Open, the Asian range, and show you a real NQDefinitionE-mini Nasdaq 100 futures contract. Known for fast, volatile moves. 1 tick = $5, 1 point = $20. chart with the Judas Swing in action.

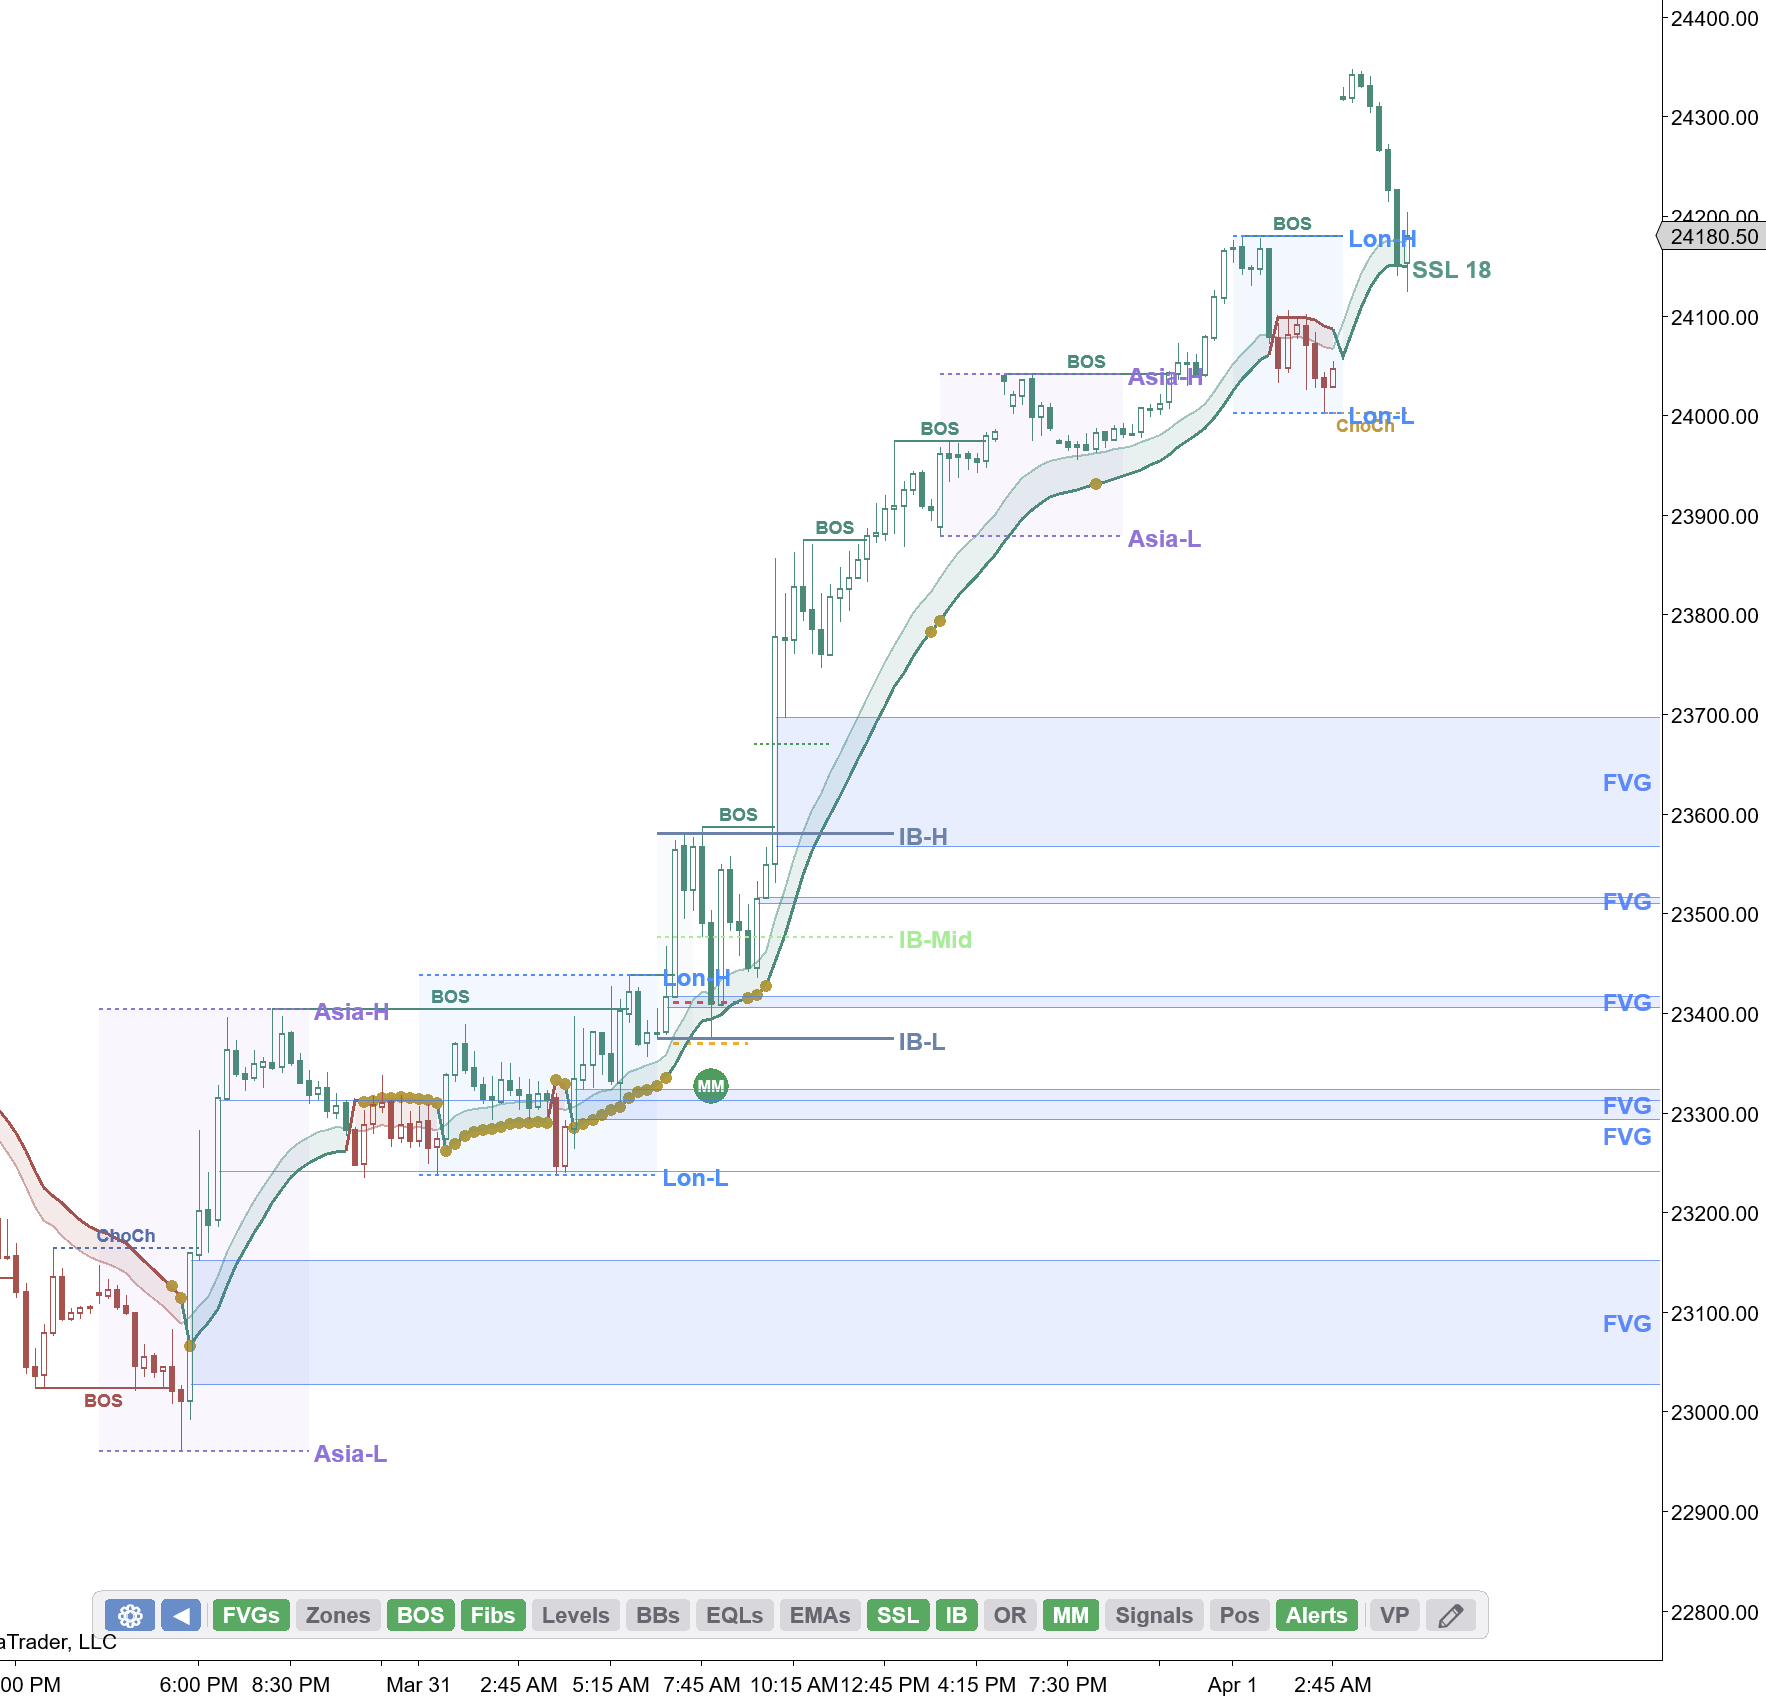
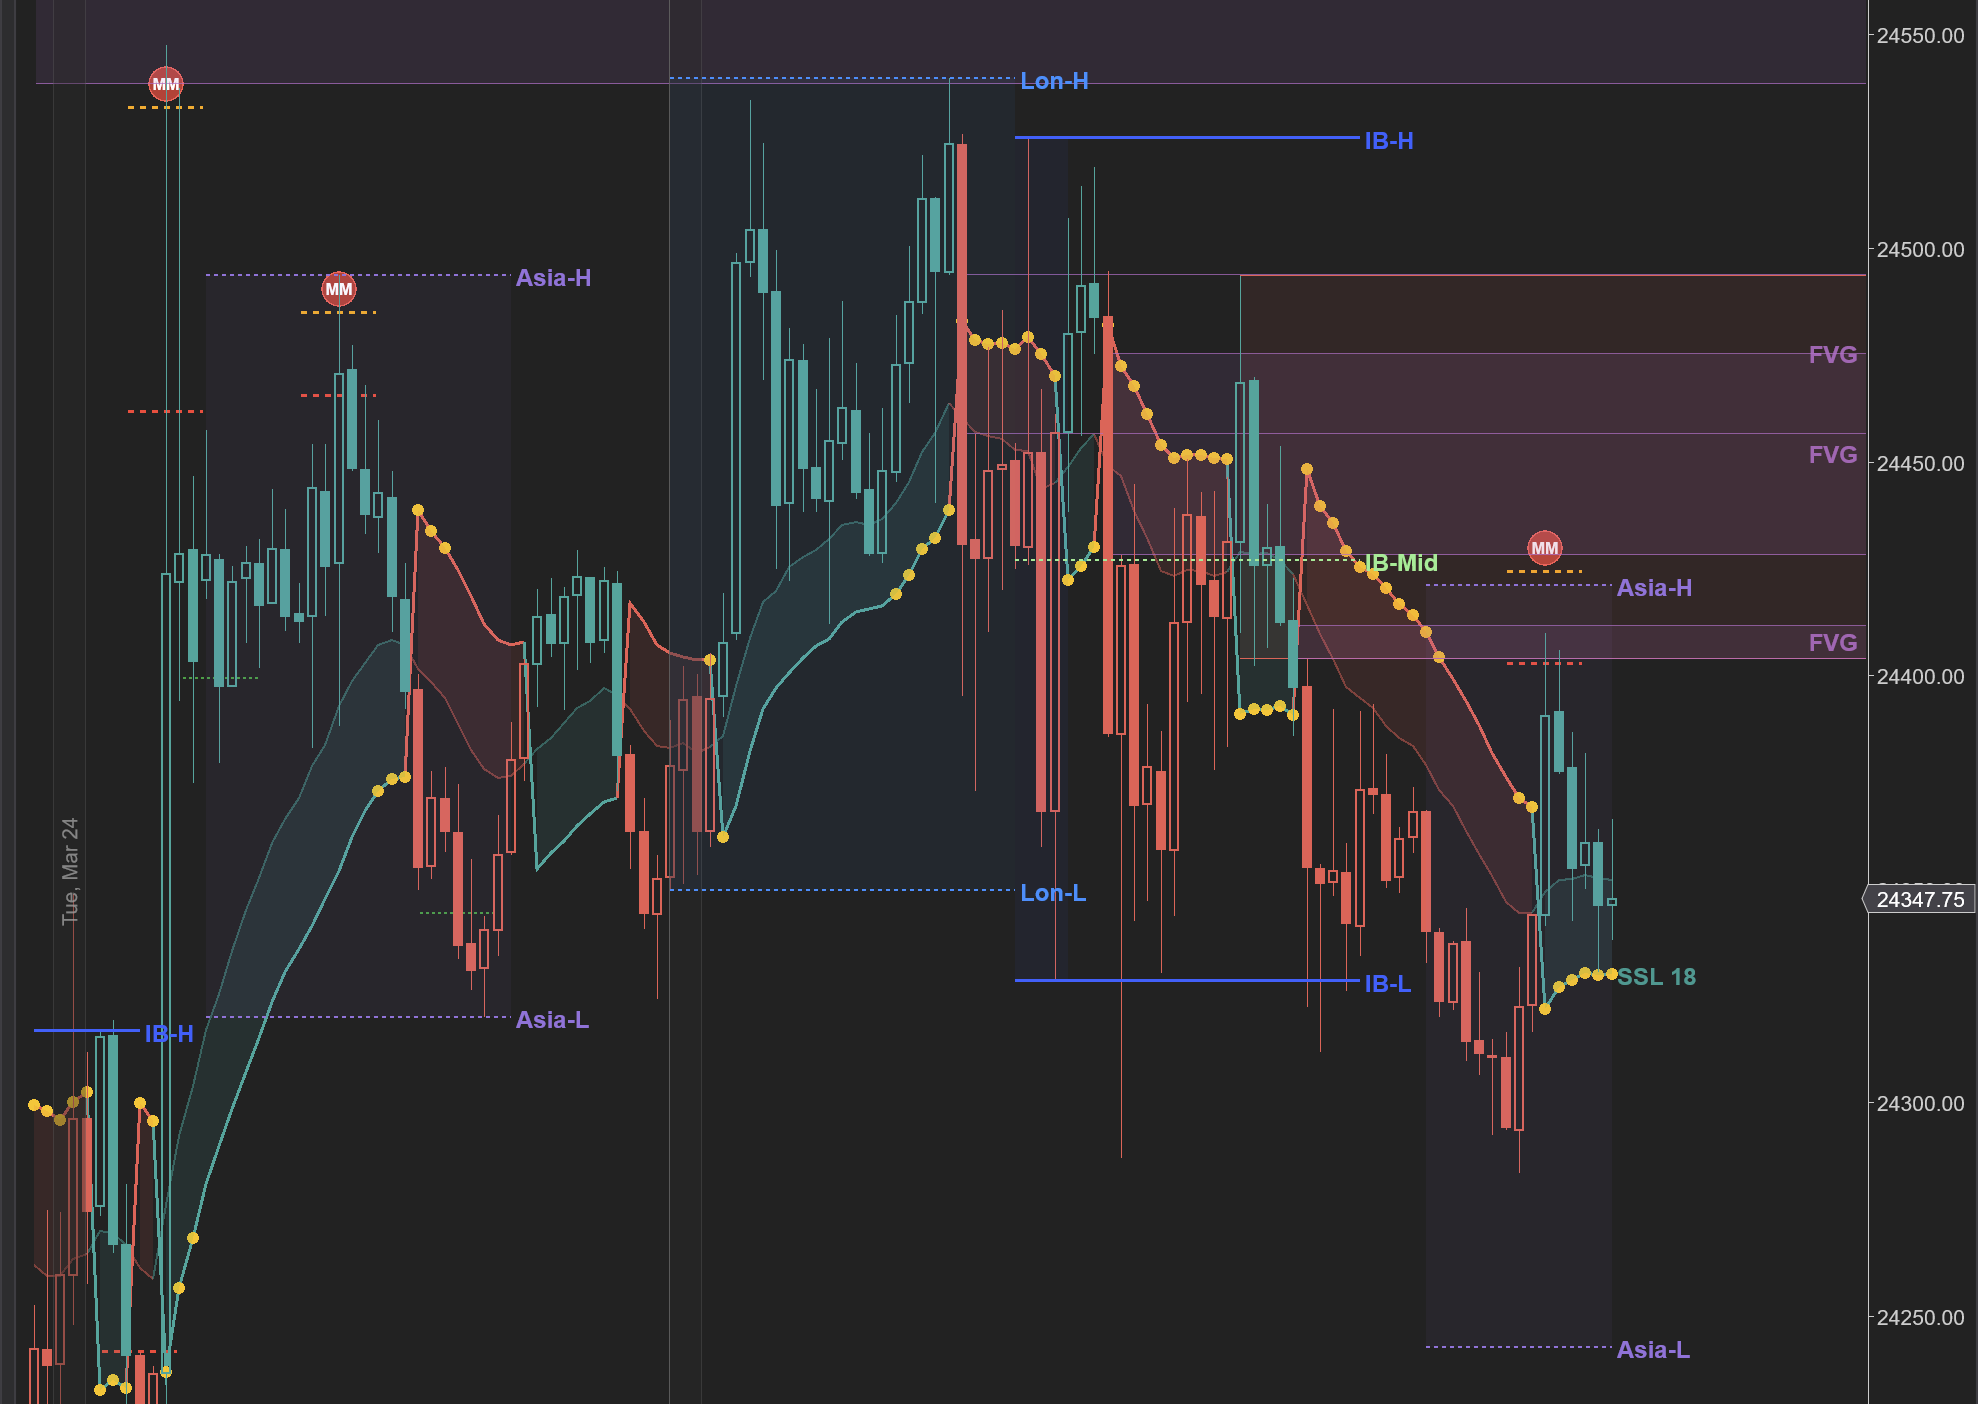
Each ICT lesson connects back to our Market Structure Indicator, which automatically plots these zones on your NinjaTrader chart — Asia-H, Asia-L, London High/Low, IBDefinitionInitial Balance — the price range of the first hour of regular trading. Sets the day's reference range. levels, FVGsDefinitionFair Value Gap — a three-candle pattern leaving a price void. Price tends to return and fill these gaps., order blocksDefinitionThe last opposing candle before an impulse move. Where the institutional order originated., and session killzones.
We built a searchable glossary covering every term across all three courses. Each term has a one-line definition, category badge, and links to related concepts. Throughout every lesson, trading terms are auto-linked with hover tooltips — tap any blue underlined term to see its definition without leaving the page.
Start Learning
Head to the Learn section to get started. We recommend starting with Market Structure if you are new to futures trading, or jumping straight to ICT Concepts if you already have the basics down. Everything is free, no account required.