Why Order Flow Matters
Most retail traders rely entirely on price action — candlestick patterns, support and resistance lines, moving averages. These tools tell you what price did. Order flow tells you why it did it.
Every candle on your chart is the result of thousands of individual orders. Some are aggressive market orders hitting the askDefinitionThe lowest price someone is currently willing to sell at. If you buy at market, this is what you pay. (buyers) or smashing the bidDefinitionThe highest price someone is currently willing to pay to buy. If you sell at market, this is what you get. (sellers). Others are passive limit orders quietly absorbing the flow. The battle between these two forces is what moves price — and a standard candlestick chart hides all of it.
Key Insight
Order flow analysis reveals who is in control at every price level, whether the move is driven by genuine aggression or passive absorption, and where the next high-probability trade is setting up.
Professional prop firms and institutional desks have used order flow tools for decades. The problem? On NinjaTrader, these tools have always been sold as separate expensive indicators — one for footprintDefinitionA chart showing bid and ask volume at every price inside each candle. Reveals who is buying and selling. charts, another for volume profiles, another for cumulative deltaDefinitionRunning total of buying vs selling across the session. Shows who has been in control overall., another for delta barsDefinitionColored bars showing net buying vs selling per candle. Blue = buyers won. Red = sellers won.. Until now.
What We Built
We combined four core order flow tools into a single NinjaTrader 8 indicator:
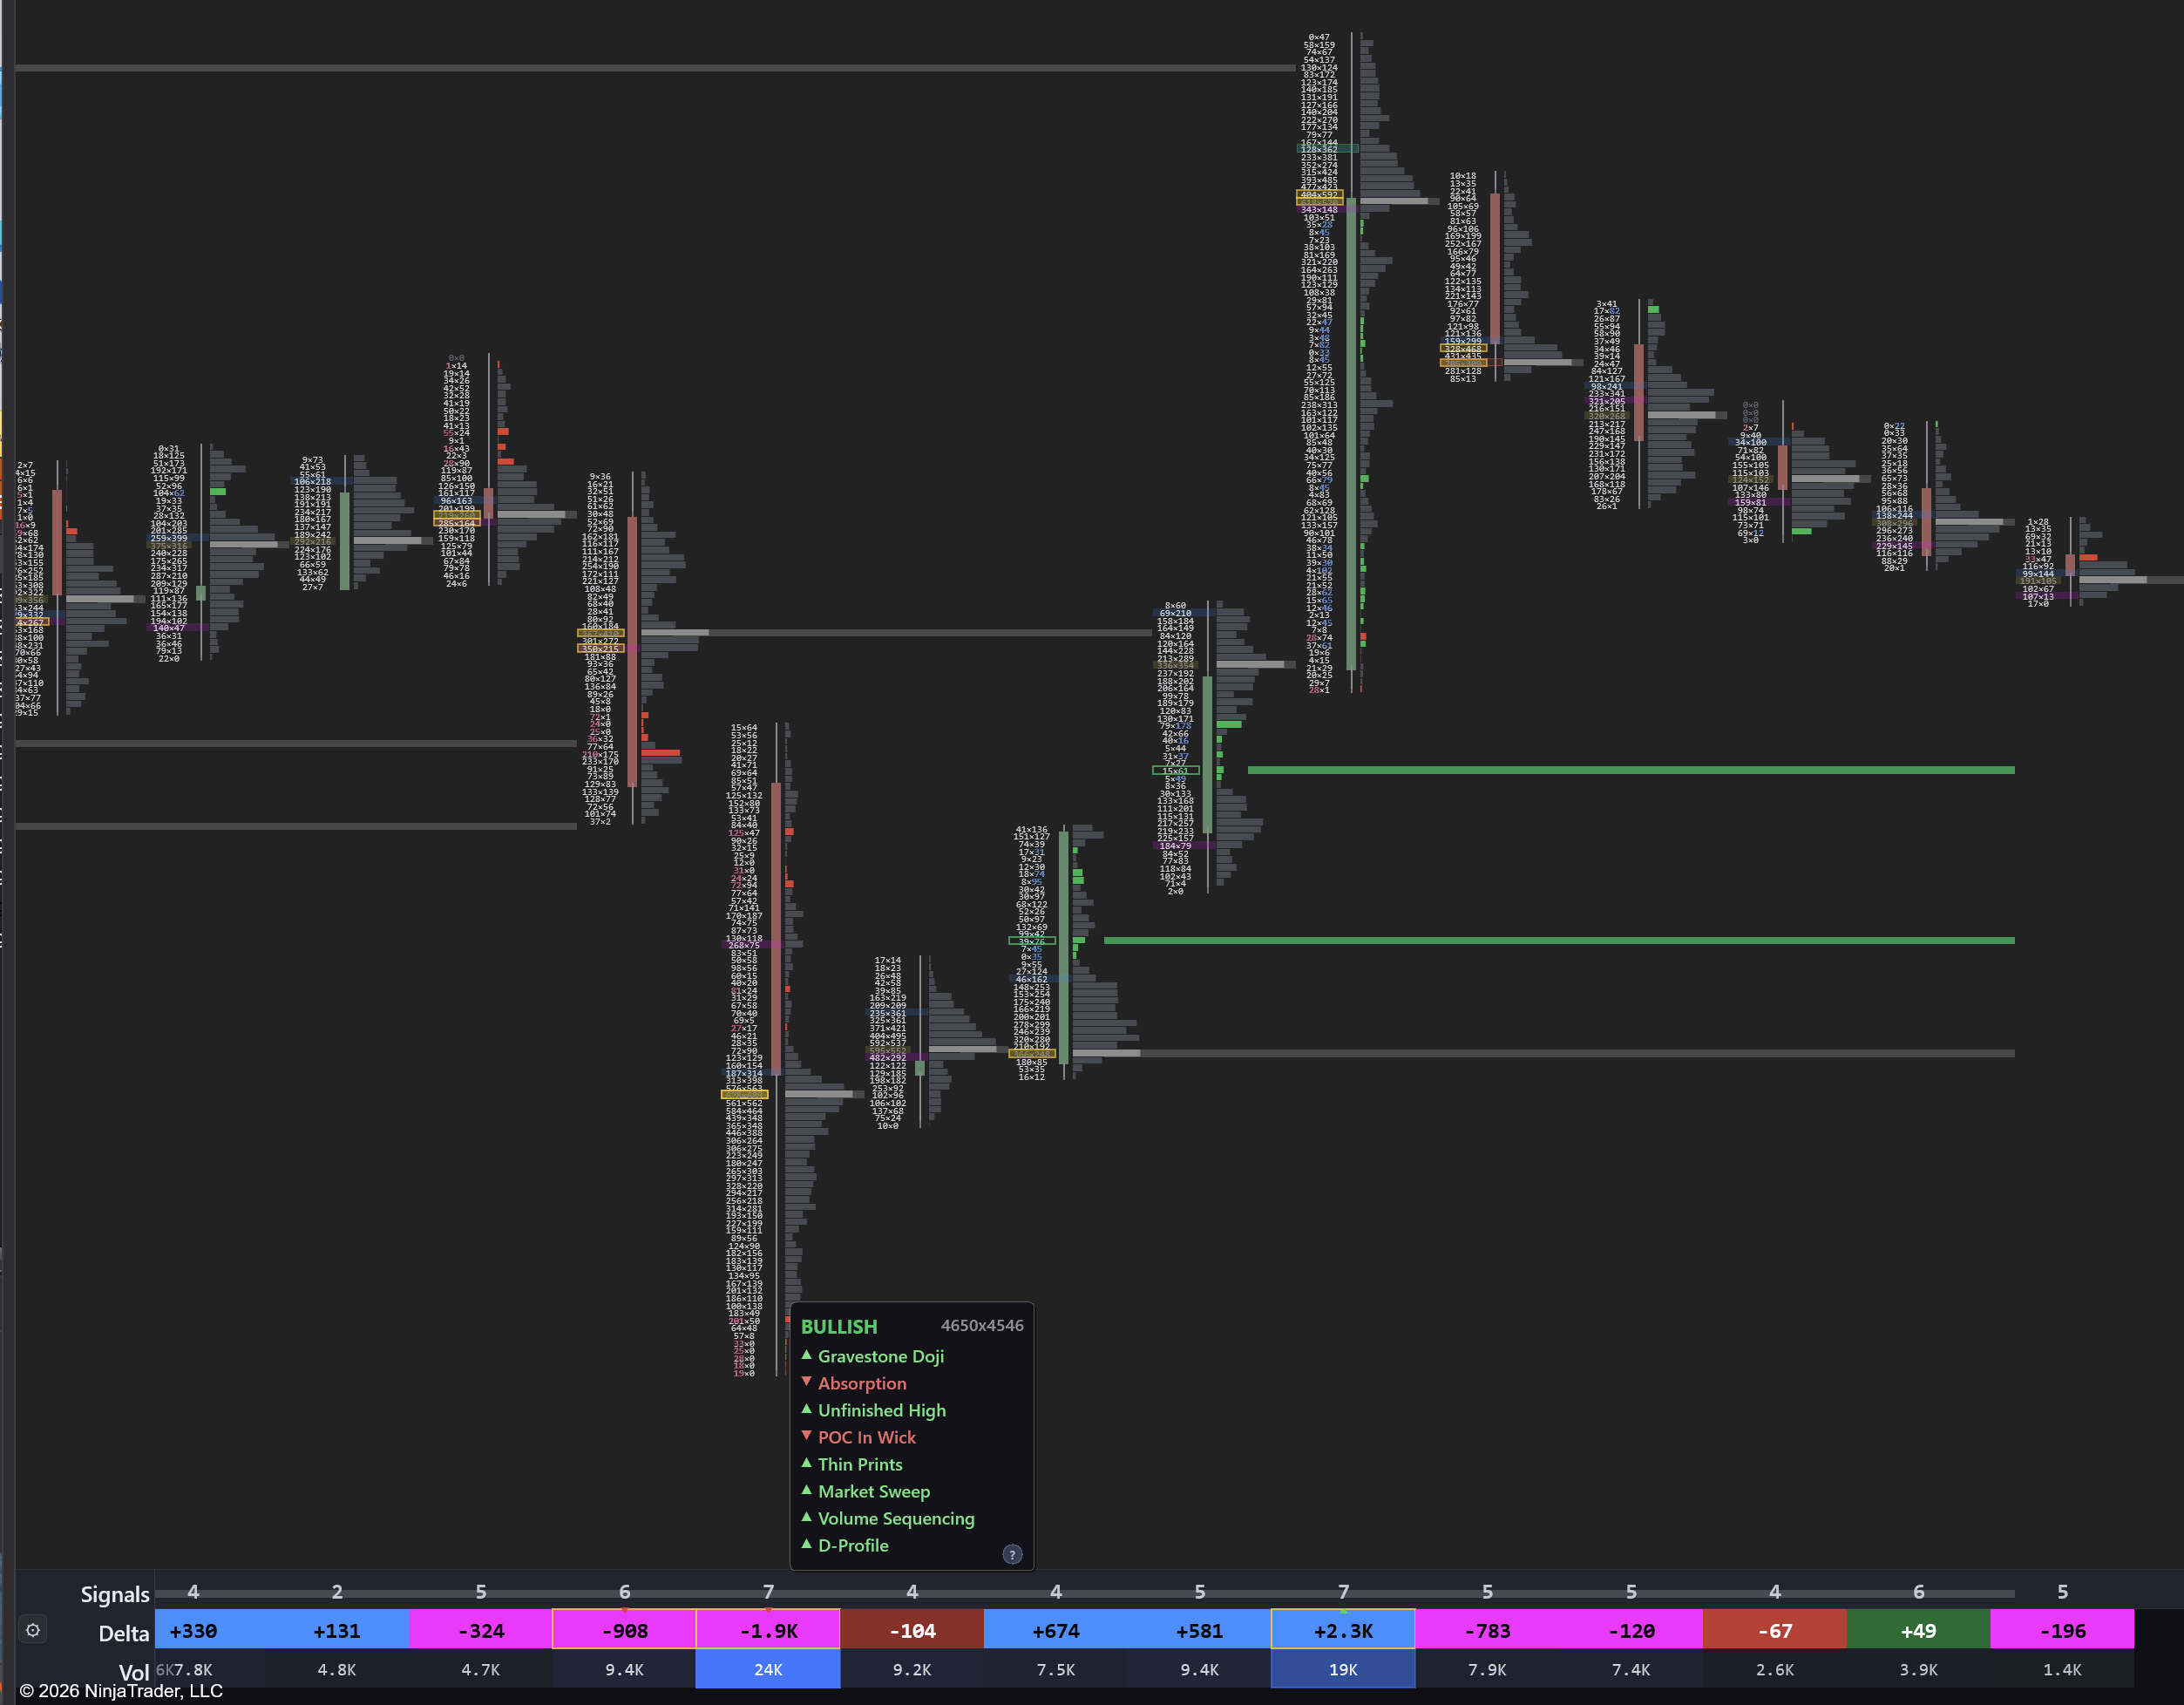
Footprint Chart The footprint shows you the bid and ask volume at every single price level inside each candle. Instead of seeing just open, high, low, close — you see exactly how many contracts traded at every tick, and whether they were aggressive buyers or sellers.
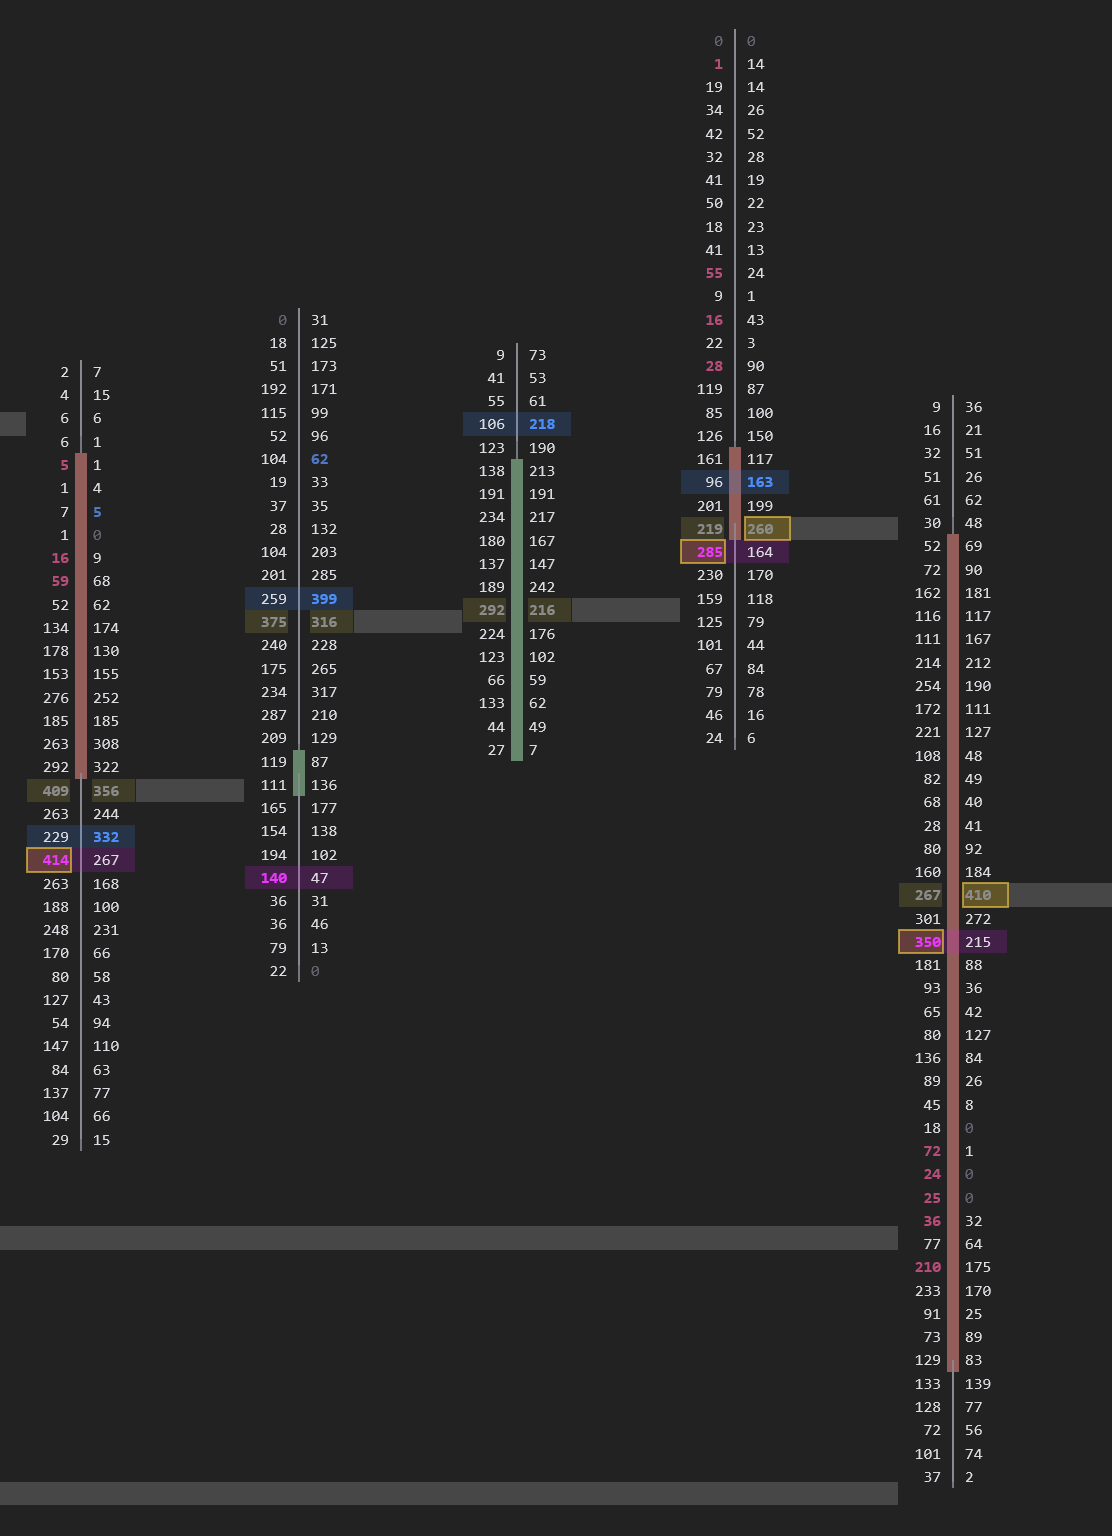
Choose from four bar styles: Bid x Ask for raw order flow data, Delta Profile for net buying vs. selling at each price, Volume ProfileDefinitionA histogram showing total volume at each price level. The widest bar is the POC. for volume distribution inside each candle, or VP + ImbalancesDefinitionA price level where one side overwhelms the other by 3:1 or more. Shows where big players committed. for the combination that highlights both volume concentration and aggressive activity.
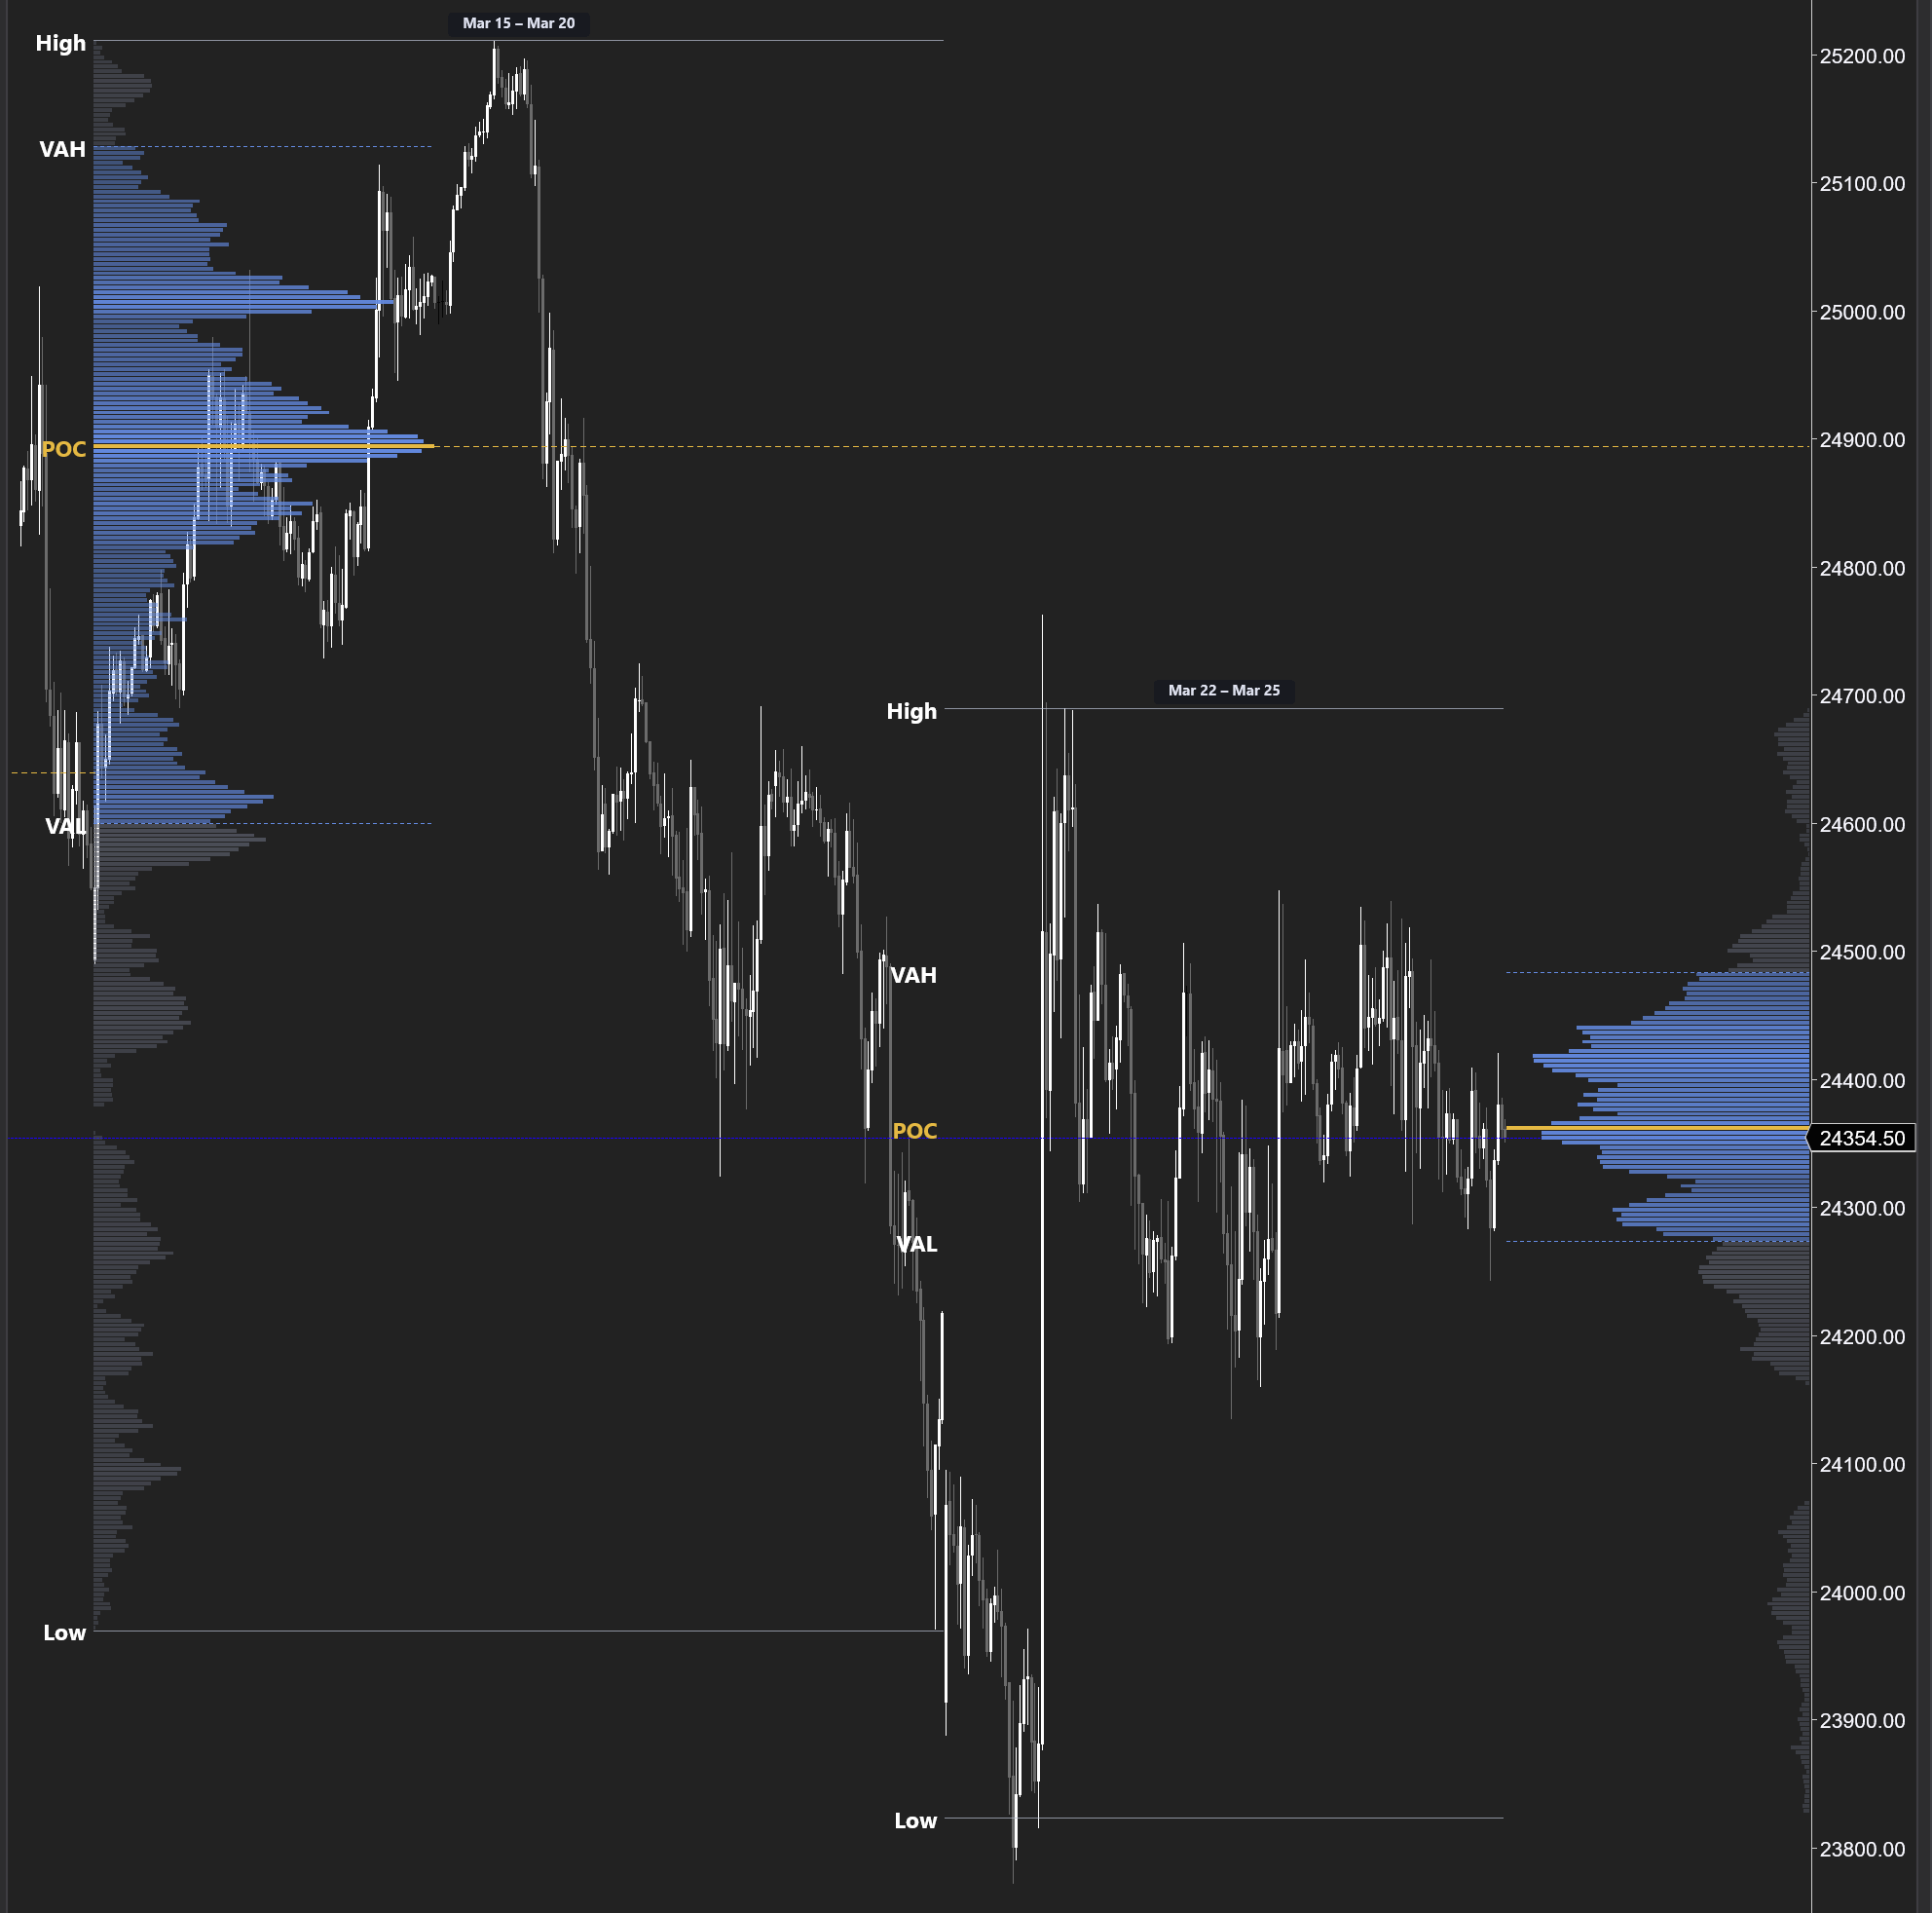
Volume Profile Session and weekly volume profiles with automatic Point of Control (POC), Value Area High (VAH), and Value Area Low (VAL). These levels reveal where the heaviest trading occurred — and where price is most likely to find support, resistance, or return to value.
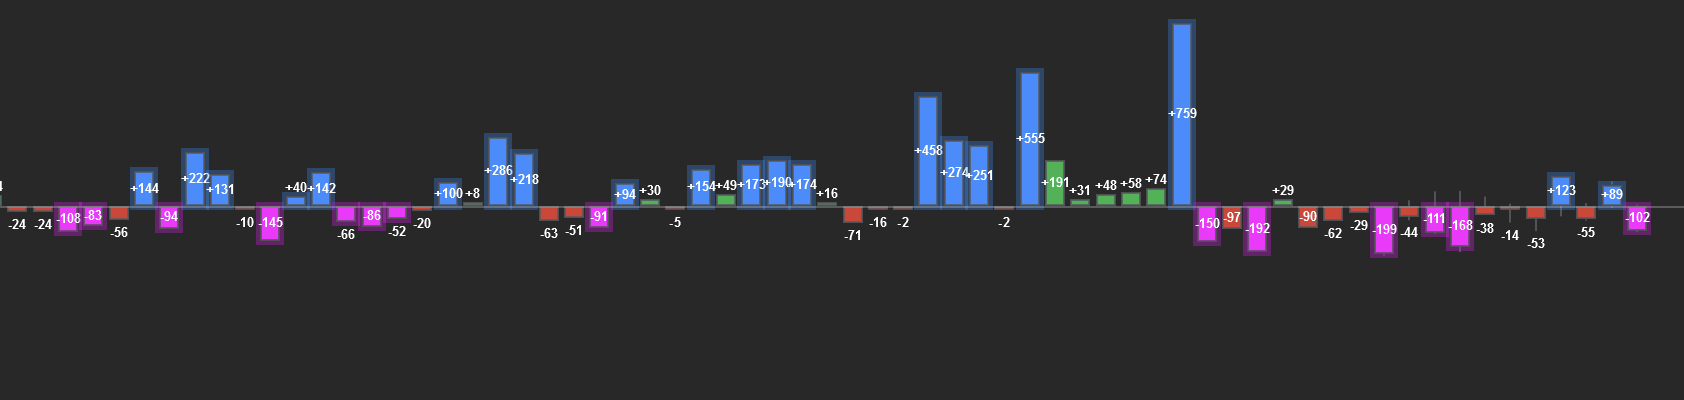
Cumulative Delta and Delta Bars
Other platforms sell cumulative deltaDefinitionRunning total of buying vs selling across the session. Shows who has been in control overall. and delta barsDefinitionColored bars showing net buying vs selling per candle. Blue = buyers won. Red = sellers won. as separate paid indicators. We built both directly into the same tool as the footprintDefinitionA chart showing bid and ask volume at every price inside each candle. Reveals who is buying and selling. — toggle between them instantly from the menu.
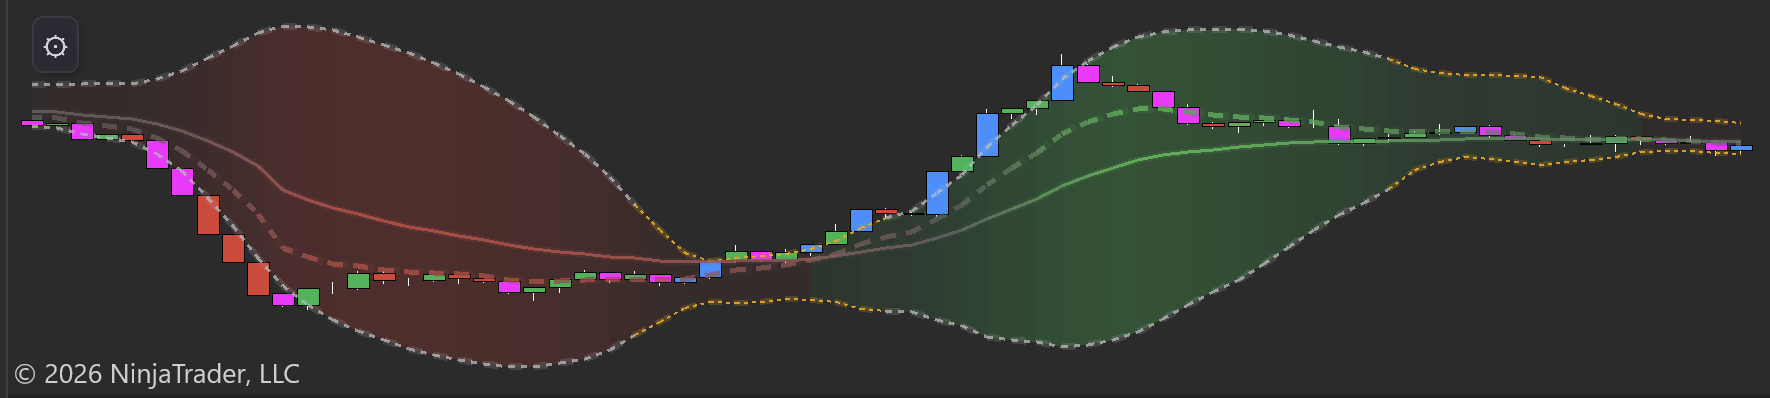
Cumulative deltaDefinitionRunning total of buying vs selling across the session. Shows who has been in control overall. tracks the running total of aggressive buying minus selling across the session. When price makes a new high but delta diverges — smart money is distributing. Delta barsDefinitionColored bars showing net buying vs selling per candle. Blue = buyers won. Red = sellers won. show the per-bar net aggression with exact numeric values, colored by imbalanceDefinitionA price level where one side overwhelms the other by 3:1 or more. Shows where big players committed. intensity.
Both modes include Bollinger Bands, EMAs, and a built-in deltaDefinitionAsk volume minus bid volume. Positive = more buying. Negative = more selling. Shows who is more aggressive. squeezeDefinitionLow volatility compression — Bollinger Bands inside Keltner Channels. Expect an explosive move when it fires. detector. When the bands compress, aggressive volume is coiling — a directional explosion is coming.
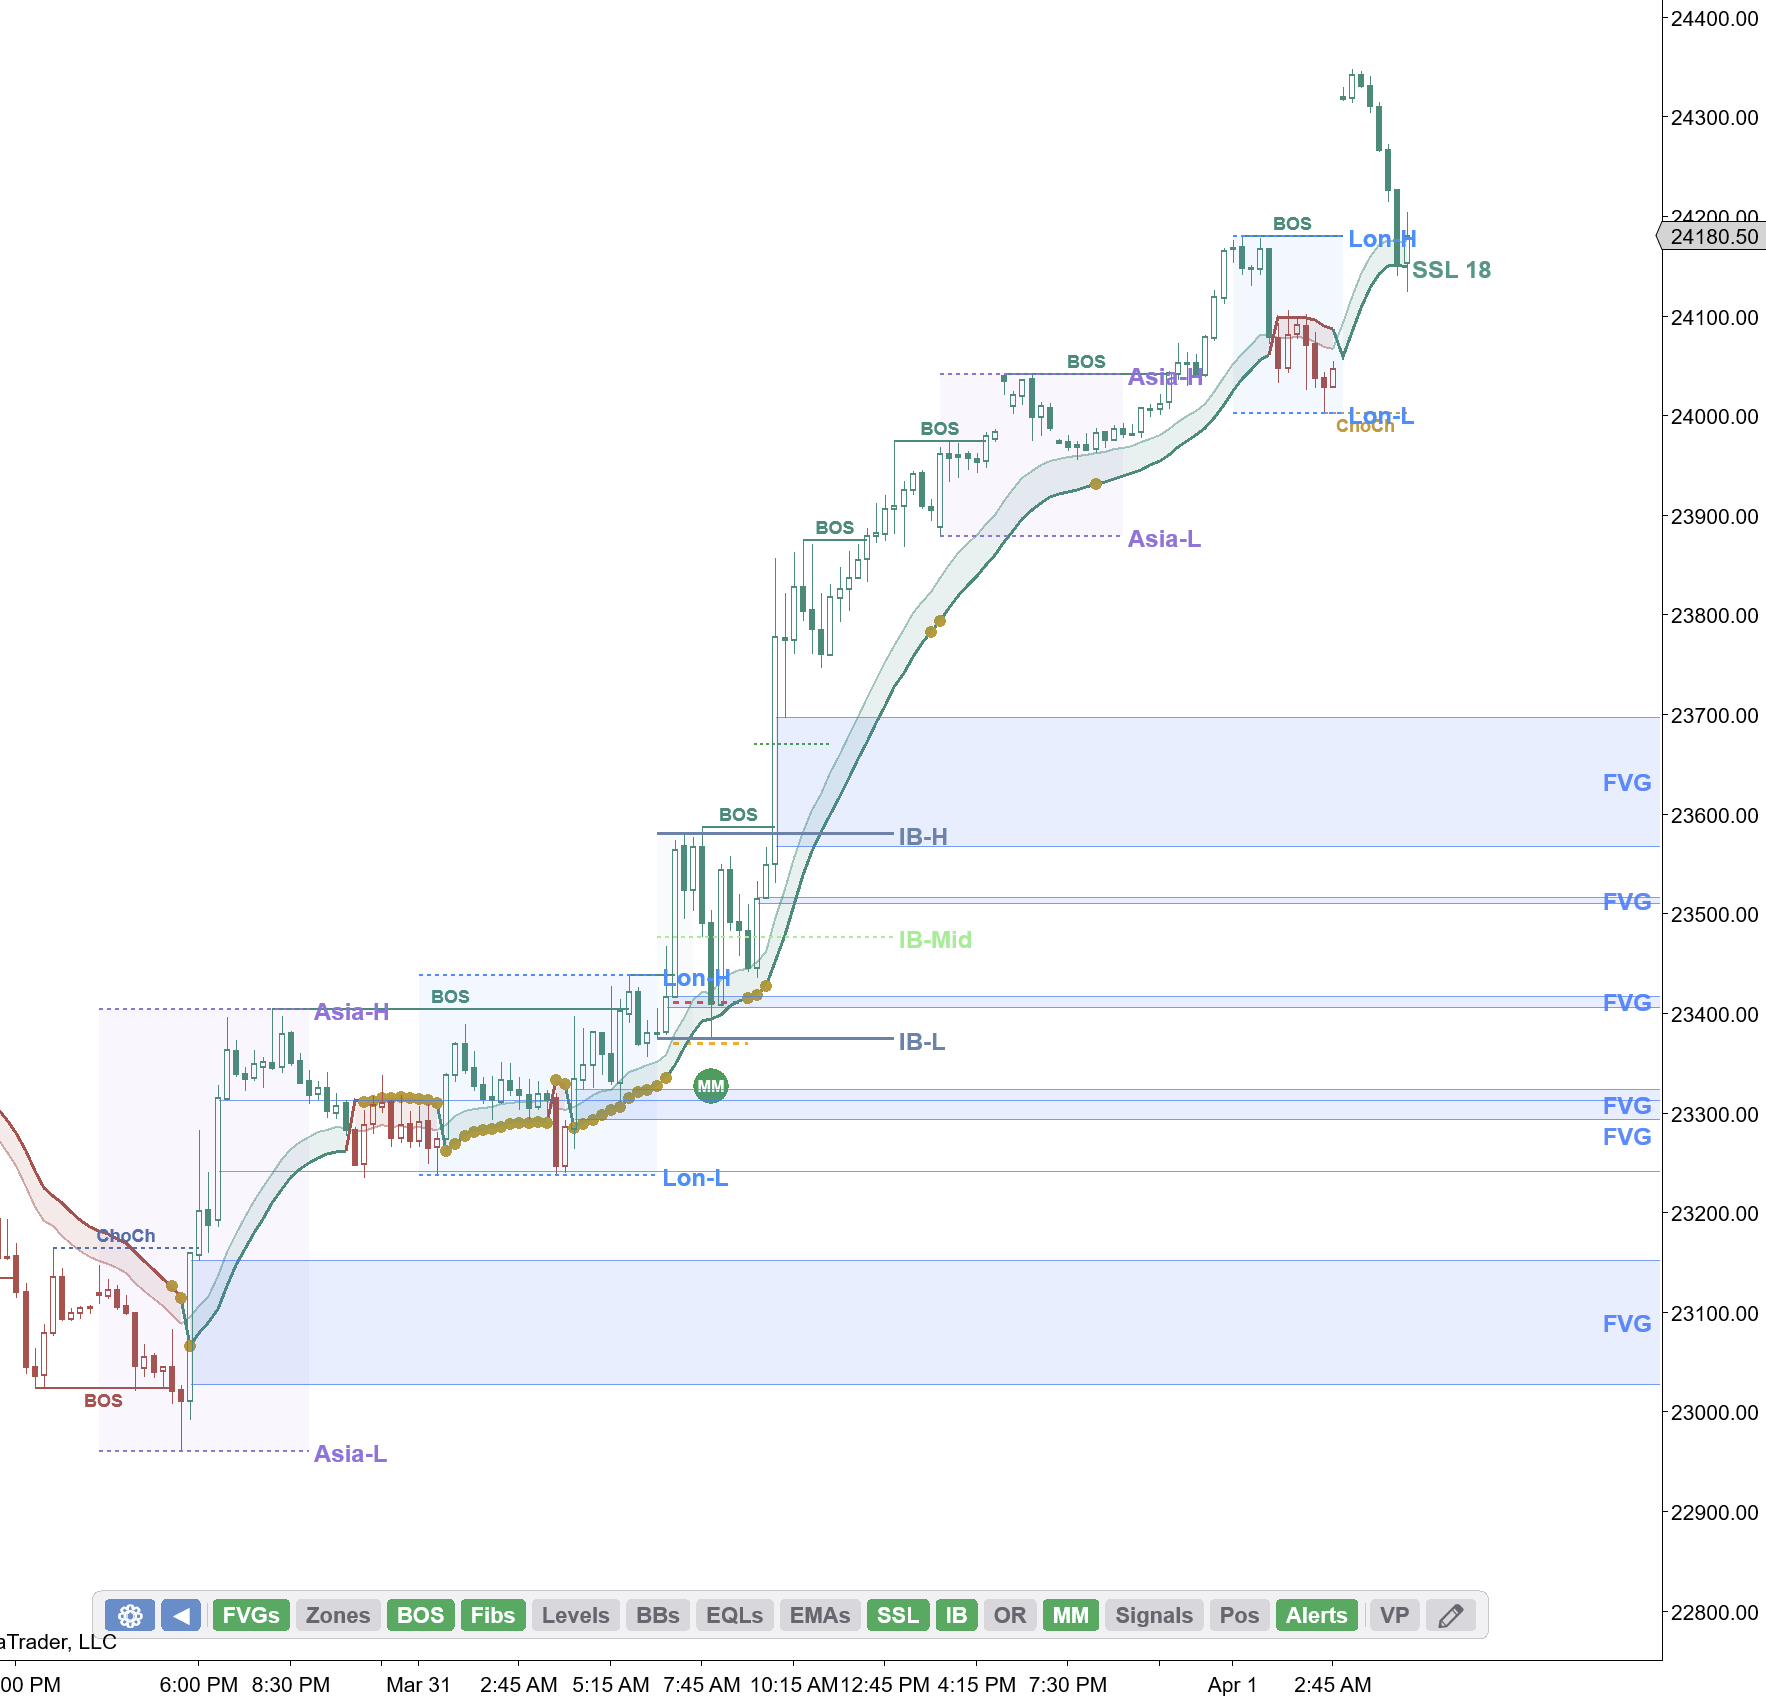
The Edge: Stacked Imbalances
This is where order flow analysis truly separates itself from price action trading. The indicator automatically detects stacked imbalancesDefinition3+ consecutive price levels where one side overwhelms the other by 3:1. Marks institutional zones. — consecutive price levels where buying or selling volume overwhelms the other side by 3:1 or more.
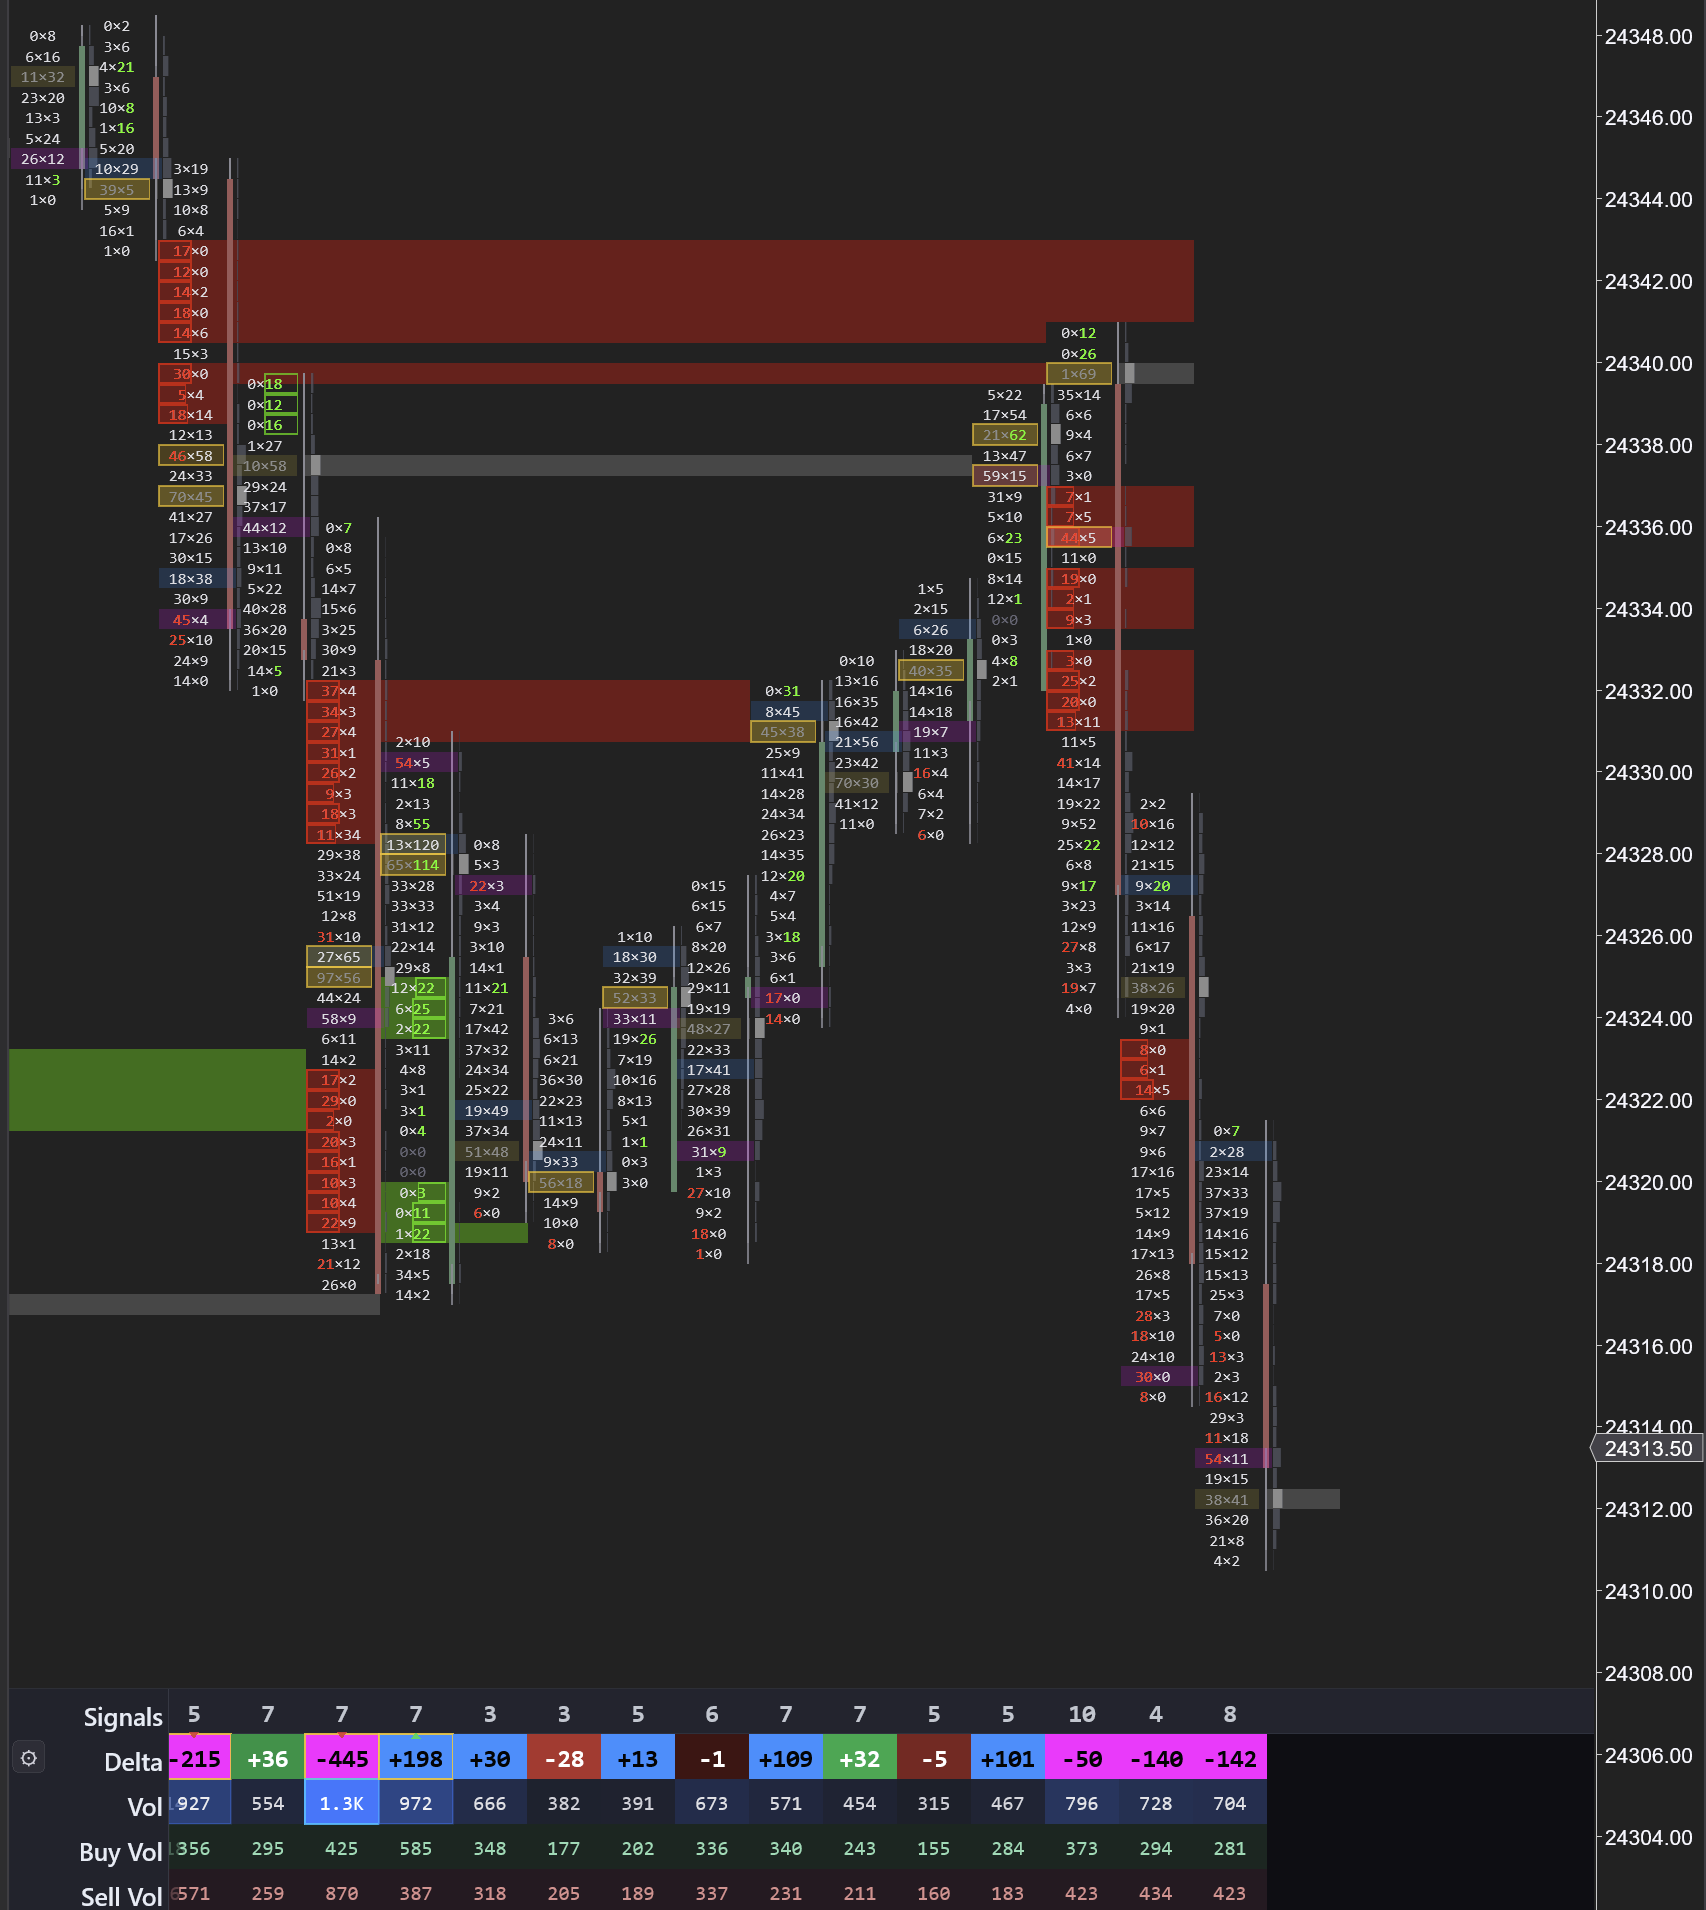
These zones mark the exact prices where institutional traders committed size. When price returns to a stacked imbalanceDefinition3+ consecutive price levels where one side overwhelms the other by 3:1. Marks institutional zones. zone, the footprintDefinitionA chart showing bid and ask volume at every price inside each candle. Reveals who is buying and selling. shows you in real-time whether the level is holding: new imbalances forming means the original participants are defending their position. Volume increasing on the retest confirms conviction. Delta flipping aggressively in the direction of the original imbalance seals it.
Key Insight
The highest-probability setup in order flow: stacked imbalance zone plus retest plus new imbalance equals continuation. No lagging indicator can give you this.
Visible Range Delta Profile
The visible range deltaDefinitionAsk volume minus bid volume. Positive = more buying. Negative = more selling. Shows who is more aggressive. profile is a volume profile colored by net delta across your entire visible chart. Blue rows show prices where aggressive buying dominated. Red rows show selling-dominant levels.
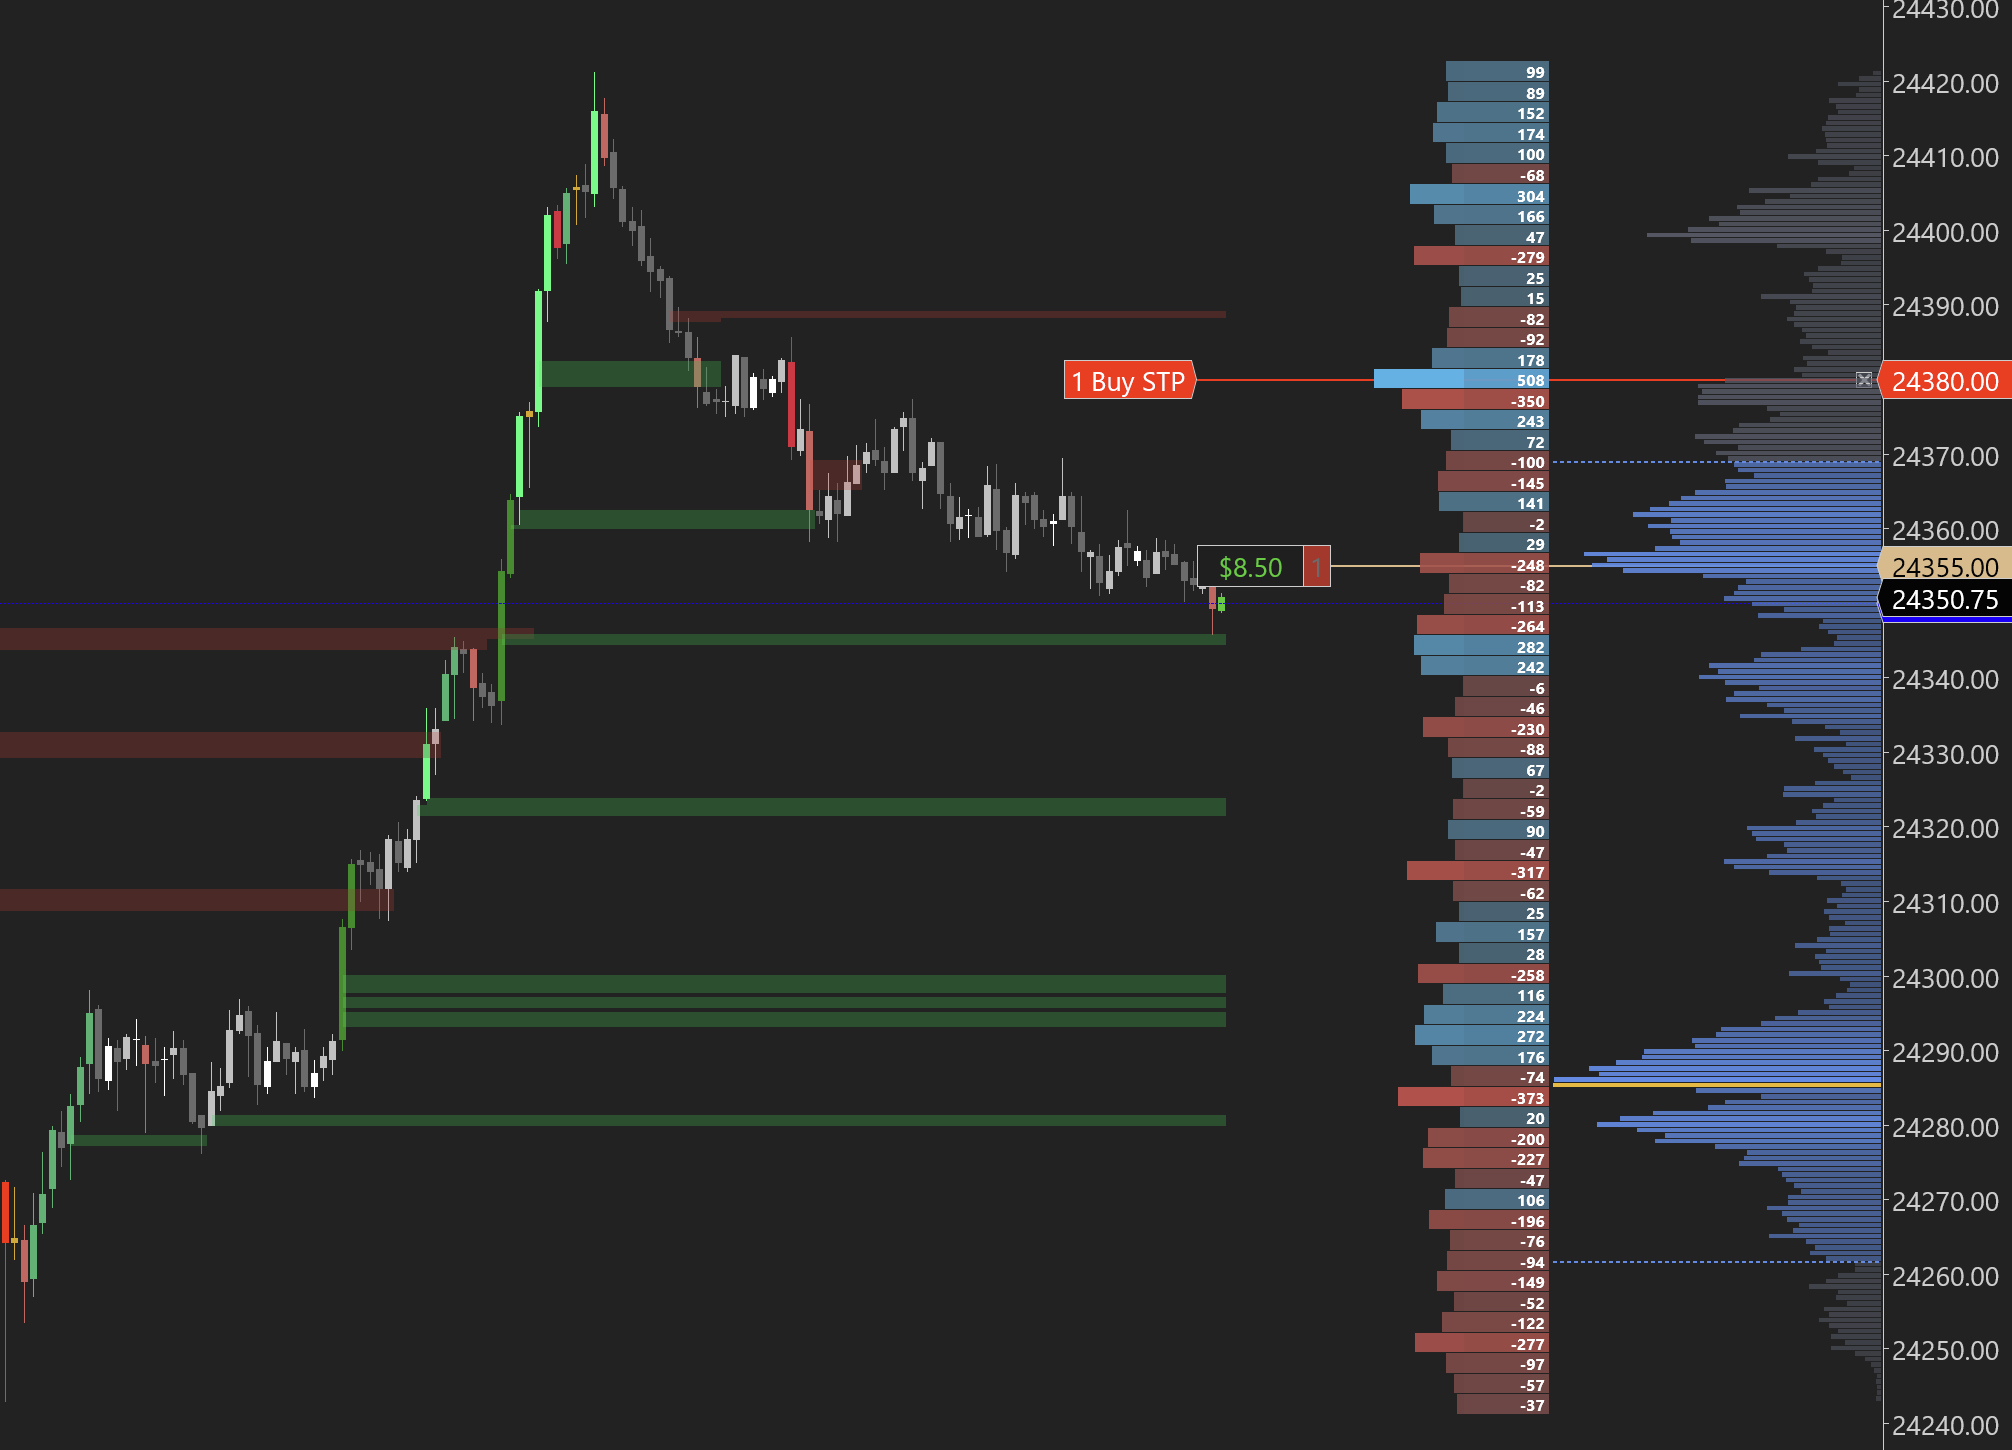
This answers the question that standard volume profiles cannot: not just where volume traded, but who was in control at each price. Use it to identify supply zonesDefinitionA price area where sellers previously overwhelmed buyers. Expect selling when price returns here. (heavy red) and demand zonesDefinitionA price area where buyers previously overwhelmed sellers. Expect buying when price returns here. (heavy blue) based on actual executed order flow.
Use What You Need — One Menu Controls Everything
Not every trader needs the full footprintDefinitionA chart showing bid and ask volume at every price inside each candle. Reveals who is buying and selling. chart on every session. Maybe you just want stacked imbalanceDefinition3+ consecutive price levels where one side overwhelms the other by 3:1. Marks institutional zones. zones plotted as support and resistance. Maybe you want cumulative deltaDefinitionRunning total of buying vs selling across the session. Shows who has been in control overall. with a visible range volume profile but no footprint bars. Maybe you want the delta profile without the bidDefinitionThe highest price someone is currently willing to pay to buy. If you sell at market, this is what you get. x askDefinitionThe lowest price someone is currently willing to sell at. If you buy at market, this is what you pay. numbers. All of this is configurable from a single comprehensive menu.
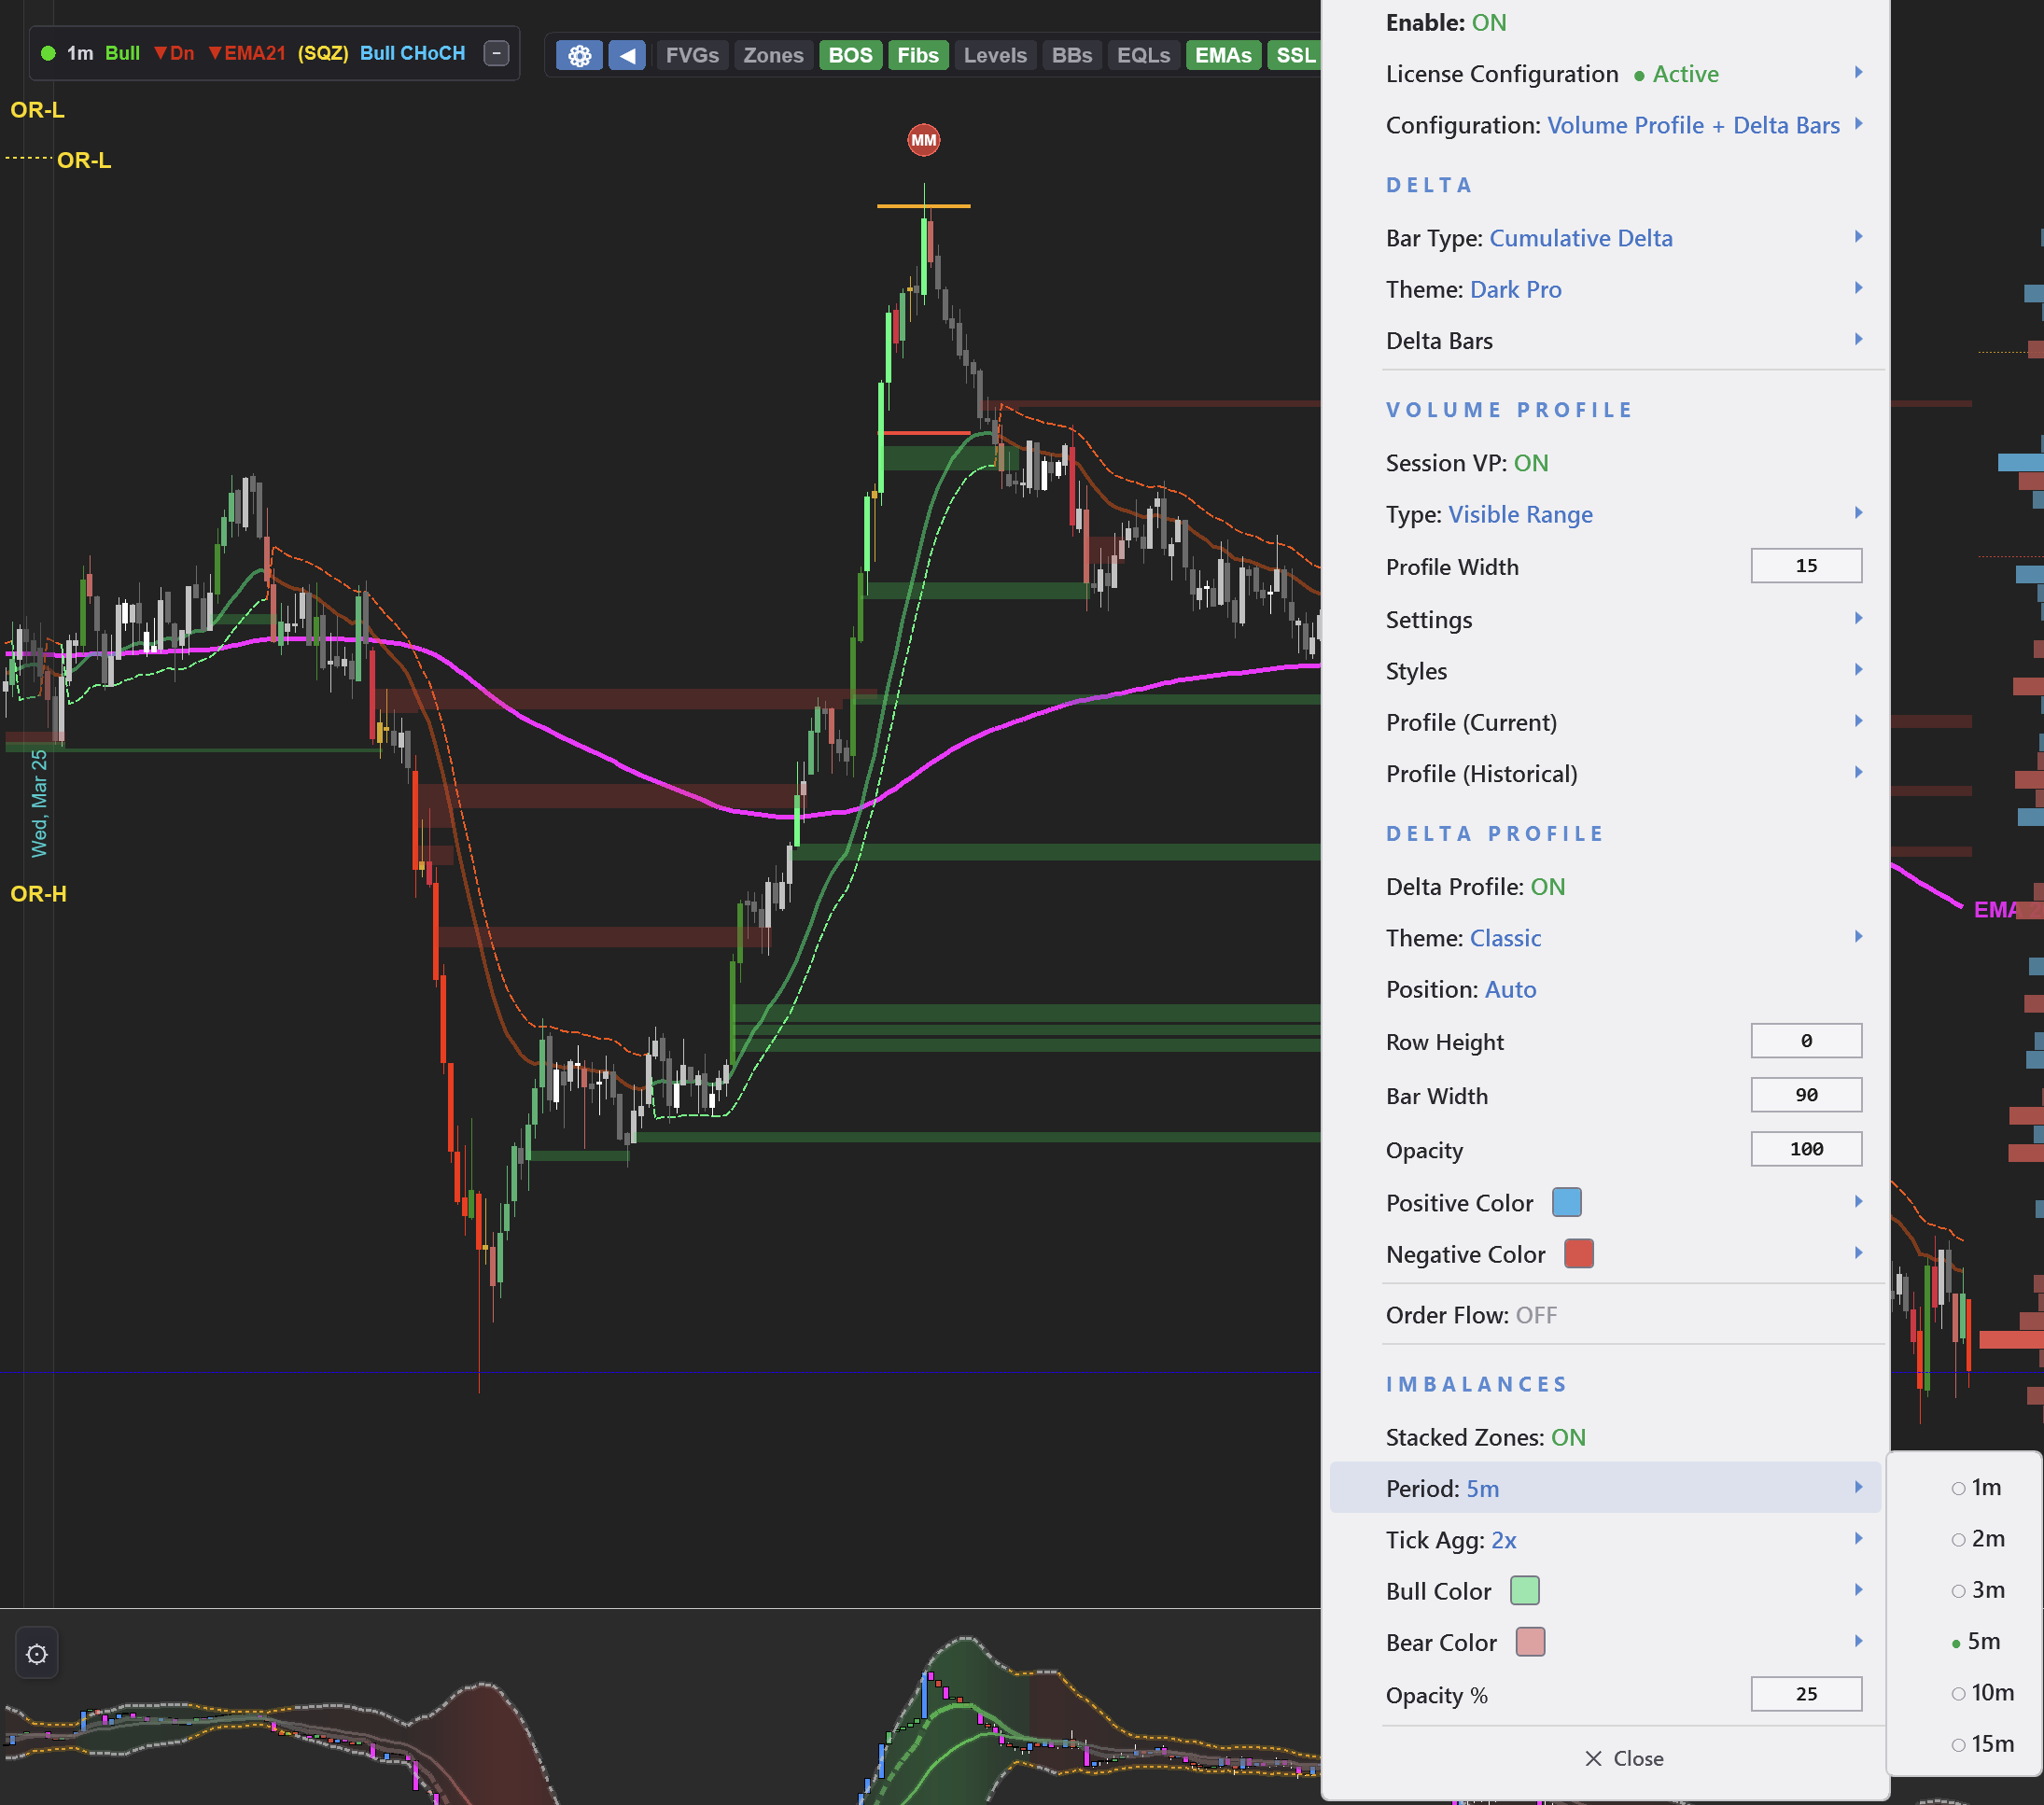
The menu is organized into clear sections: Delta (cumulative deltaDefinitionRunning total of buying vs selling across the session. Shows who has been in control overall. or delta barsDefinitionColored bars showing net buying vs selling per candle. Blue = buyers won. Red = sellers won., theme selection), Volume ProfileDefinitionA histogram showing total volume at each price level. The widest bar is the POC. (session VP, visible range, profile width and styles), Delta Profile (color-coded volume at price), and ImbalancesDefinitionA price level where one side overwhelms the other by 3:1 or more. Shows where big players committed. (stacked zones with period, tick aggregation, and color settings). Every feature is independent — enable exactly the combination you want without any of the features you do not.
Key Insight
This is not four separate indicators duct-taped together. It is one unified tool where every feature shares the same data pipeline, the same menu, and the same license. Turn on what you need, turn off what you do not.
30+ Signals, 10+ Themes, Full Customization
Every feature toggles independently. Big imbalancesDefinitionA price level where one side overwhelms the other by 3:1 or more. Shows where big players committed., oversized imbalances, inverse imbalances, reversal imbalances, absorptionDefinitionHeavy aggressive orders hit a level but price doesn't move — a large passive player is absorbing the flow., exhaustion, stopping volume, fading momentum, max deltaDefinitionAsk volume minus bid volume. Positive = more buying. Negative = more selling. Shows who is more aggressive., thin prints, unfinished business, market sweeps — all detected automatically and fully configurable.
Choose from 10+ themes that match your chart style. Every color is customizable with a full color picker. Set your own thresholds for what counts as a significant imbalanceDefinitionA price level where one side overwhelms the other by 3:1 or more. Shows where big players committed..
One Indicator, One License
Volume ProfileDefinitionA histogram showing total volume at each price level. The widest bar is the POC.. Cumulative DeltaDefinitionRunning total of buying vs selling across the session. Shows who has been in control overall.. Delta BarsDefinitionColored bars showing net buying vs selling per candle. Blue = buyers won. Red = sellers won.. FootprintDefinitionA chart showing bid and ask volume at every price inside each candle. Reveals who is buying and selling. Chart. On other platforms, you are paying separately for each of these — often on a monthly subscription. We built all four into a single indicator with a one-time lifetime license.
Key Insight
Stop paying for four separate indicators. The OrderFlow indicator combines everything you need to read the tape into one unified tool for NinjaTrader 8 — with a free 5-day trial to prove it.
This is the complete order flow toolkit. No subscriptions. No indicator stacking. No chart lag. Just the data you need to see who is in control of the market.