You now have every piece: swing highsDefinitionA peak on the chart where price reversed lower. Marks where sellers previously overpowered buyers. and lows, trends, CHoCHDefinitionChange of Character — the first warning a trend may be ending. Price breaks a swing point in the opposite direction., BOSDefinitionBreak of Structure — confirms a trend change. Price breaks the next swing point after CHoCH., impulse and correctionDefinitionEvery trend is a series of impulse legs (the move) and correction legs (the entry). See the market structure lesson.. The last piece is understanding that structure exists on every timeframe at the same time — and that the 15-minute and the 2-minute can tell you different stories about the same market.
The 15-minute can be screaming "buy" while the 2-minute looks like a collapse. Both are correct. One is the trend. One is the pullback.
Markets Are Fractal
The same patterns — HH, HL, LH, LL, CHoCHDefinitionChange of Character — the first warning a trend may be ending. Price breaks a swing point in the opposite direction., BOSDefinitionBreak of Structure — confirms a trend change. Price breaks the next swing point after CHoCH. — repeat on every timeframe. A 15-minute uptrend is built from smaller uptrends on the 2-minute. The pullbacks inside that uptrend are themselves mini downtrends with their own LH and LL structure.
This is not a contradiction. It is how trends actually work:
- The higher timeframeDefinitionThe longest timeframe in a multi-timeframe stack — typically daily or 4-hour. Determines overall bias. sets the direction — who is winning the war
- The lower timeframeDefinitionThe shortest timeframe in a multi-timeframe stack — typically 1m or range bars. Used for trade triggers. shows the individual battles — small wins for both sides
- When the higher timeframeDefinitionThe longest timeframe in a multi-timeframe stack — typically daily or 4-hour. Determines overall bias. is bullish, every lower-timeframe pullback is just a losing battle in a war the buyers are winning

Walking Through the Diagram
Start on the left.
- Downtrend — LH and LL stepping down. The deepest low is marked as the Strong Low. That is the level buyers finally defend.
- CHoCHDefinitionChange of Character — the first warning a trend may be ending. Price breaks a swing point in the opposite direction. — price breaks above the last lower high. First yellow light. The downtrend is in question.
- First BOSDefinitionBreak of Structure — confirms a trend change. Price breaks the next swing point after CHoCH. — price makes a new HH and confirms the uptrend. Bias is now long.
- Pullback — price drops back toward a higher low. On the 15-minute it is just a routine pullback. On the 2-minute, it looks like a full downtrend: LH, LL, LH, LL. A beginner trading only the 2-minute would short here and get run over.
- Second BOSDefinitionBreak of Structure — confirms a trend change. Price breaks the next swing point after CHoCH. — the 15-minute HL holds, price rips back up, and makes another higher high. The uptrend continues.
That full story happened in the span of one 15-minute pullback.
Real Chart Example — MNQ 15-Minute
Here is the same pattern playing out on a live 15-minute MNQDefinitionMicro E-mini Nasdaq 100 — 1/10th the size of NQ. 1 tick = $0.50, 1 point = $2. Fast moves, beginner-sized risk. chart. Notice the CHoCHDefinitionChange of Character — the first warning a trend may be ending. Price breaks a swing point in the opposite direction. as the downtrend breaks, the first BOSDefinitionBreak of Structure — confirms a trend change. Price breaks the next swing point after CHoCH. confirming the flip, a clean pullback to the higher low, and the second BOS pushing to new highs — exactly the structure we just walked through.
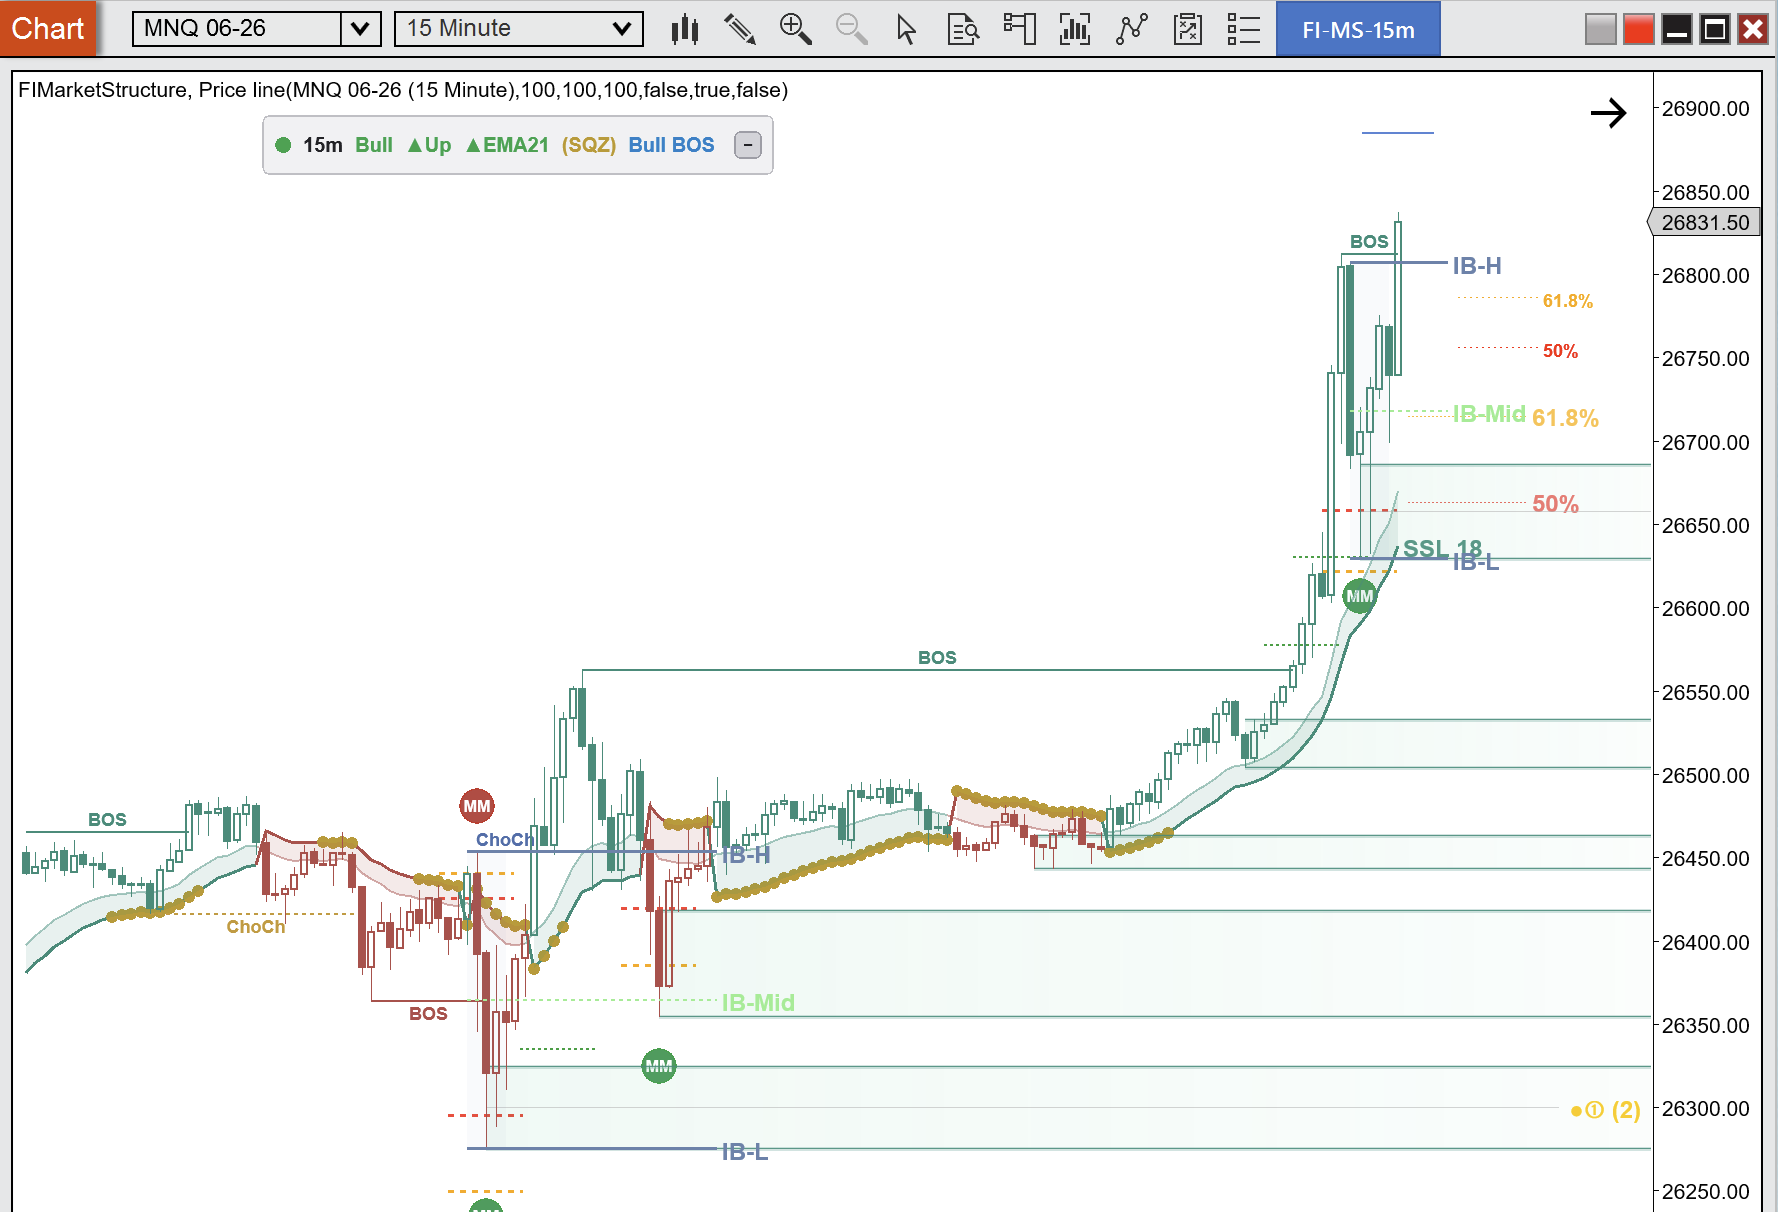
This is the same story as the diagram above — just with real candles instead of clean lines. Once you start seeing this pattern on charts, you will see it everywhere.
Zoom in on that same chart and look at what the pullback actually was — a clean 50% retracement of the bullish leg, right on top of the measured moveDefinitionA price projection where Leg B equals Leg A. Halsey's primary target is the -23.6% extension beyond 100%. entry.
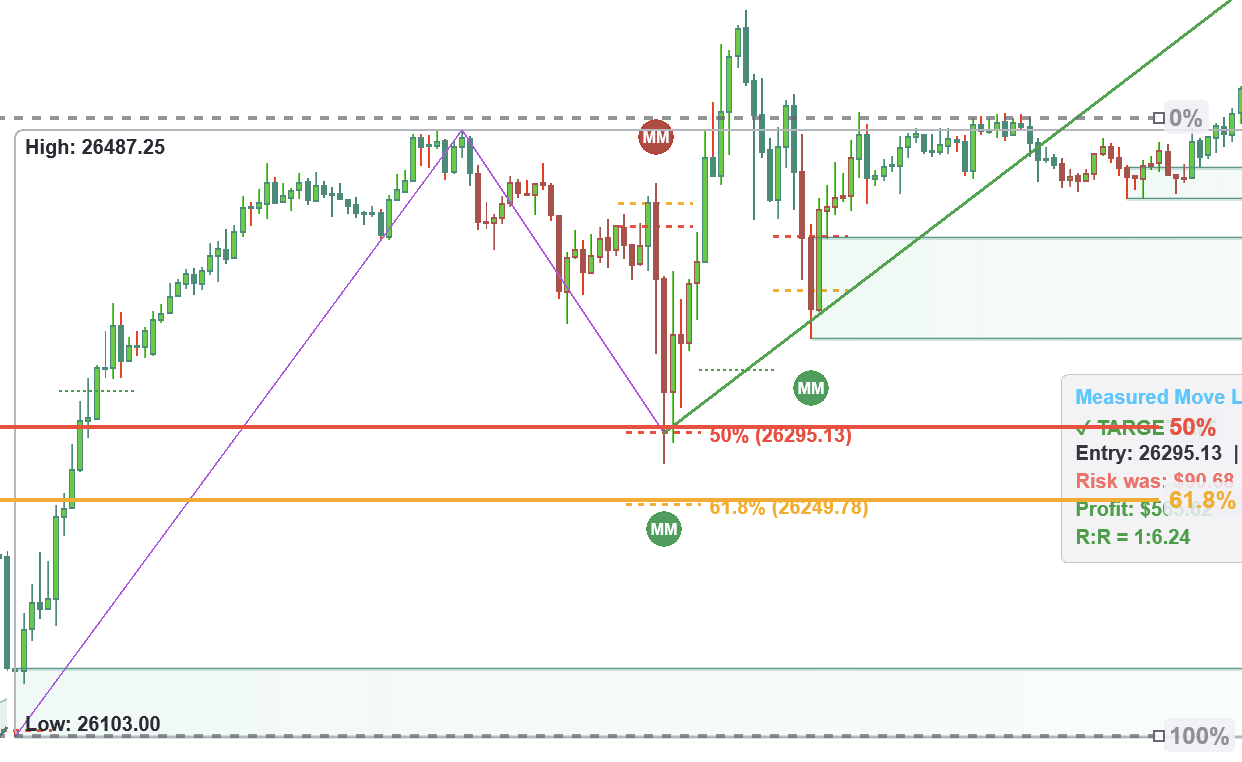
The real "swing" on the 15-minute was just a 50% retracement in a very bullish move — exactly where structure told us to buy. Target hit at the -23.6% extension. R:R of 1:6.24.
The Trade Plan
Once you can read this, the workflow is simple:
- Zoom out to the 15-minute — confirm the trend (CHoCHDefinitionChange of Character — the first warning a trend may be ending. Price breaks a swing point in the opposite direction., first BOSDefinitionBreak of Structure — confirms a trend change. Price breaks the next swing point after CHoCH., HH + HL intact)
- Wait for the pullback — do not chase the move. Let price come to you
- Watch the 2-minute during the pullback — it will look bearish. That is normal
- Wait for the 2-minute to flip — a small CHoCHDefinitionChange of Character — the first warning a trend may be ending. Price breaks a swing point in the opposite direction. or BOSDefinitionBreak of Structure — confirms a trend change. Price breaks the next swing point after CHoCH. on the 2-minute after the 15-min HL holds
- Enter long on the flip — you now have 15-min direction, the HL level, and a 2-min trigger
- Invalidate below the Strong Low — if price breaks it, the whole thesis is wrong. Get out
Higher timeframeDefinitionThe longest timeframe in a multi-timeframe stack — typically daily or 4-hour. Determines overall bias. for direction. Mid timeframe for the level. Lower timeframeDefinitionThe shortest timeframe in a multi-timeframe stack — typically 1m or range bars. Used for trade triggers. for the trigger. When all three align, the trade works.
Common Mistakes
- Shorting the 2-minute pullback inside a 15-minute uptrend — you are fighting the bigger move
- Entering before the 15-minute HL confirms — you will get stopped out on the last LL of the 2-minute leg
- Ignoring the Strong Low — it is your invalidation level, not an afterthought
- Letting the lower timeframeDefinitionThe shortest timeframe in a multi-timeframe stack — typically 1m or range bars. Used for trade triggers. override the higher timeframeDefinitionThe longest timeframe in a multi-timeframe stack — typically daily or 4-hour. Determines overall bias. — if the 2-minute is bearish but the 15-minute is bullish, the 2-minute is just the pullback
Key Takeaways
Structure is fractal. The higher timeframeDefinitionThe longest timeframe in a multi-timeframe stack — typically daily or 4-hour. Determines overall bias. tells you the direction. The lower timeframeDefinitionThe shortest timeframe in a multi-timeframe stack — typically 1m or range bars. Used for trade triggers. tells you the trigger. When they disagree, trust the higher timeframe and use the lower timeframe pullback as an entry opportunity — not as a reversal signal.
The 15-minute bullish trend will always have bearish pullbacks on the 2-minute. That is not a contradiction — that is how trends work. Every pullback is an opportunity to buy into the bigger move at a better price.
Master this, and you stop fighting the market. You start trading with it.