
Stacking gamma by strike
The flip is one number. The GEX profile is the whole picture: net gamma stacked at every strike. When you draw it, a few strikes tower over the rest — and those become the levels price reacts to.
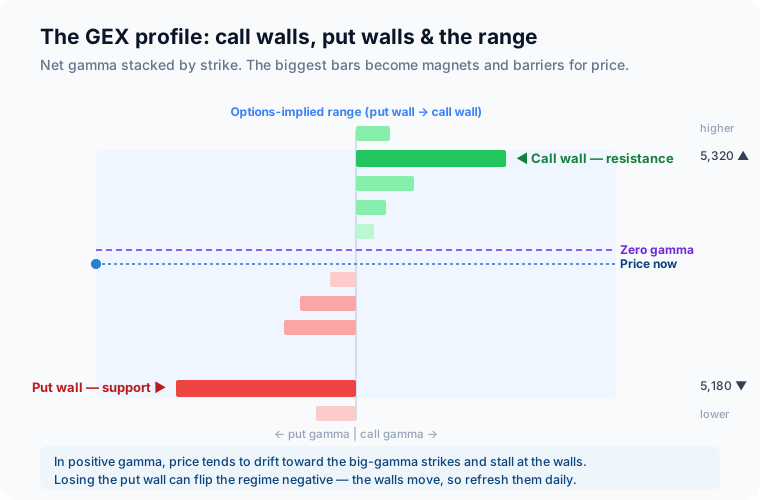
Call wall = resistance, put wall = support
- The call wall is the strike with the largest positive (call) gamma. In positive-gamma conditions dealers sell into strength as price approaches it, so it tends to act like a ceiling — resistance.
- The put wall is the strike with the largest negative (put) gamma. Dealers buy into weakness as price approaches it, so it tends to act like a floor — support.
- The space between the put wall and the call wall is roughly the range the options market is positioned for. On a positive-gamma day, price often drifts between them and stalls at each edge.
The walls behave differently by regime
The walls are strongest in positive gamma, where dealers defend them — fade the edges and expect the range to hold. In negative gamma, a wall that breaks can turn into an accelerant instead of a barrier: the level that would have capped price now becomes the spot where hedging piles on. Same level, opposite meaning, depending on the regime.
In a calm market the walls are guardrails. In a volatile market, a broken wall is an on-ramp. Always read the walls through the regime you are in.
How the Market Structure Indicator plots this
You do not have to compute any of this by hand. Turn on GEX (Dealer Positioning) in the Market Structure Indicator and it pulls the index ETF's live options chain (QQQ for NQDefinitionE-mini Nasdaq 100 futures contract. Known for fast, volatile moves. 1 tick = $5, 1 point = $20., SPY for ESDefinitionE-mini S&P 500 futures contract. Tracks the S&P 500 index. 1 tick = $12.50, 1 point = $50. Most heavily traded index future.) on a running timer, then draws the key strikes straight onto your futures chart — already scaled from ETF prices into your contract's price.
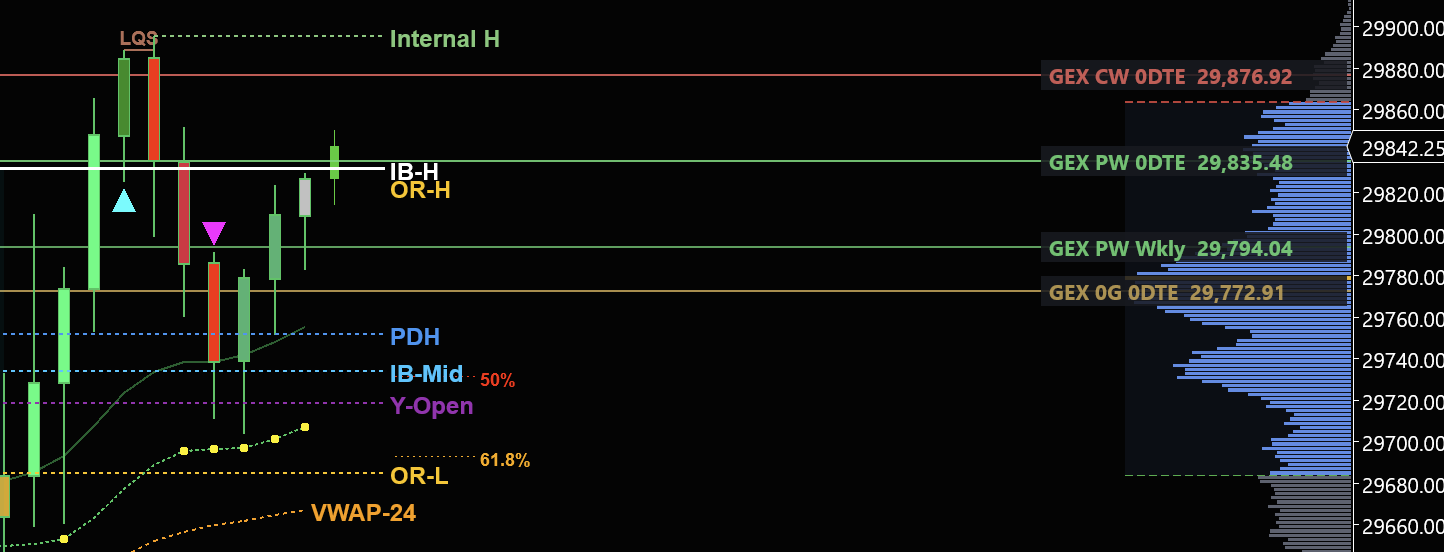
- GEX CW (red) — the call wall: sticky ceiling and upside target.
- GEX PW (green) — the put wall: sticky floor and downside target.
- GEX 0G (gold) — the zero-gamma flip: the line between the calm and volatile regime.
Every line is tagged by tenor — 0DTE (expires today, the intraday levels) and Wkly (this Friday, the structural ones) — so you can watch, say, the 0DTE call wall and the weekly put wall at the same time. A draggable summary pill shows the current regime (positive or negative gamma), the underlying, total GEX and your distance to each wall; clicking it opens a full analysis window with both tenors and a regime-by-regime playbook.
Putting it together
Three numbers give you a full daily map: the flip (which regime), the call wall (upside barrier or target), and the put wall (downside barrier or target). The next lesson turns that map into an actual plan for ESDefinitionE-mini S&P 500 futures contract. Tracks the S&P 500 index. 1 tick = $12.50, 1 point = $50. Most heavily traded index future. and NQDefinitionE-mini Nasdaq 100 futures contract. Known for fast, volatile moves. 1 tick = $5, 1 point = $20..